

The chart above is the long term chart of Natural Gas going back to 1994 on the monthly scale. You can see that after very steep vertical declines the Natural Gas Contract has a tendency to stop on a full retest and do a double bottom before trending higher.
It remains to be seen whether or not Natural Gas will trend all the way down near the 3 range again but I consider it at least a possibility.

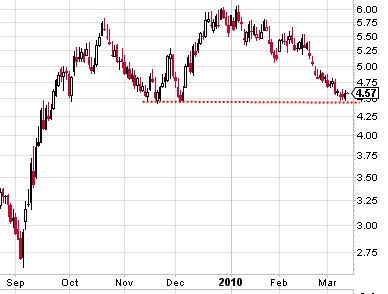
Zooming in closer you can see that the price is sitting on crucial support area and there is a large tradable void below this red dotted support line.
If we break it, the move could possible extend down to the 3 range again.
That would set up a potential very significant buy opportunity. It may also set up a potential opportunity in the UNG Natural Gas ETF which is already breaking to new 52 week lows and is currently trading in the 8 range.
If the actual Natural Gas Contract trades down to the 3 range or slightly lower, then I would not be surprised to see the UNG trading below 5 or even lower. So my sense is that there is a potential very big buy opportunity setting up in the UNG as long as the actual contract can hold long term support and get some kind of a double bottom accomplished.
Whether the UNG ETF can survive that kind of decline remains to be seen. The daily volume traded in the UNG is enormous and higher than I have seen for most other ETFs. But I am crossing my fingers that they do not discontinue this ETF when it is at rock bottom single digit prices.