
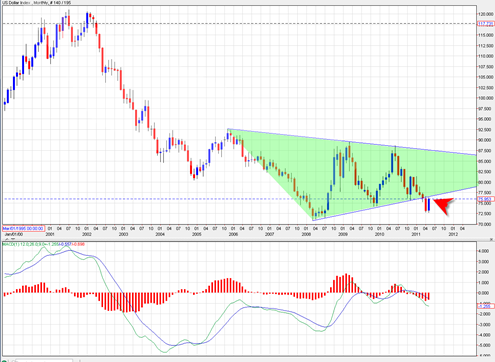
The US Dollar Index is at an important juncture. On the long term monthly candlestick chart the US Dollar Index has shown us that it has broken down through and out of a very large symmetrical triangle formation. This was very bearish action and seems to imply much more longer term bearish action for the US Dollar index.
The problem is that sometimes symmetrical triangles on all time frames turn into failures and busted patterns. A busted pattern symmetrical triangle exists when you first get a downside breakthrough out of a symmetrical triangle and then the price loses downside momentum, reverses, and then busts back up inside the structure of the symmetrical triangle and then busts back up topside in an upside breakout of the pattern. Busted patterns can be very powerful signals on all time frames.
The location of the US Dollar Index right now on the monthly chart is not suggesting to me that we are about to be in a busted pattern, but the chart is showing that there could be some potential for a busted pattern to occur.

There is bullish triple P on the monthly MACD histogram for the US dollar index and this could lead to a confirmation next month or in a few months. The red arrow points to the large blue up monthly bar that shows the US Dollar is trading back up in the form of a kiss of the underside resistance line.
The US Dollar Index is going to need to break up and through 77 level for me to start believing that this index wants to bust back inside its pattern. This would be potentially bullish for the dollar and bearish for the stock market longer term.
I do find it interesting the way the US dollar index chart is set up on the longer term time frame relative to the June 13, 2011 Marty Armstrong cycle turning point. Could it be that the US Dollar Index is making a major bottom here on this 8.6 year cycle and the stock market a major top? It could very well be, but will need to see more confirming action in the weeks ahead.
The NYSE summation index is showing more bearish action ahead for the sp500. If we do not see some big drops in the market the next couple of weeks then there could be something wrong with the bearish scenario for the sp500.
I know a trader who does a lot of cycle work, and he predicted that the second of this year would be very bearish. This guy has always been pretty accurate with his cycle calls. With the end of QE 2, and the problems in Europe, I think we do get a dollar bounce. Markets usually move inverse to the dollar, which means further downside for the markets. This summer will probably be more bearish than last summer.
Sounds plausible to me RMT, that is what I am seeing in the charts now as well on the longer term time frames, but we do not quite have the true confirmation yet in terms of price action, but seems like we are slowly getting there.