
I went short again this morning about 11:22 am. I had to do it. And the bears deserve a lot of credit at what they were able to accomplish today in terms of price destruction. Getting close to mid day the downside volume on the SPY was projecting close to 300 million. A bearish triple M was formed on the Sp500 daily chart and the doji and hanging man candlestick I mentioned in yesterday’s post were confirmed today. Today’s decline also completely engulfed the previous 4 days of weekly price action and invalidated the weekly MACD histogram buy signal that I thought might be confirmed today.
So the weekly downtrend is intact, the daily is starting to roll over down again and we may once again be headed for a challenge of 1040 support. If 1040 support does not hold on this next test it would seem we have lots more room to expand to the downside.
The daily macd is starting to curl down again and this would be the second time it has failed under the zero line which is a very bad sign.
The market is still creating a series of lower highs and is still under the 50 and 200 day moving average. I mentioned in yesterday’s post that we were at a pivotal juncture in the market. The market spoke today and showed its hand. It wants to go lower.

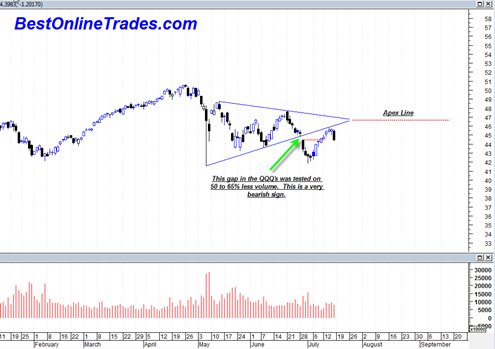
If you look at the PowerShares QQQ Trust Series 1 chart, it is clear that the QQQ’s have been trading in a symmetrical triangle. On June 29, 2010 the QQQQs broke down through this symmetrical triangle on volume of 136 million shares. A few days later a new rally began in early July and price retraced almost right back up to the apex of this triangle. This is quite a common occurrence. They key point about the upside retracement rally for me is the fact that the gap down on 6/29/2010 (gaps act like resistance or support) was tested on 50 to 65% less volume on the recent July rally. This is a very bearish sign and essentially makes the last 5 days rally ‘smoke and mirrors’. No wonder the last weeks rally was retraced so strongly in just one day today. The lack of volume was saying the rally was not to be believed.

I suspect that we are going to trade right down into a major low by August 10 to 12th, 2010. That would be about 15 to 20 trading days from now and would likely be a very significant low at that time. The daily MACD is not fully in bear mode yet so I think it will work its way towards a full bearish mode next week and then allow a cascade down the following two weeks.
A piece of good news for the bears. The Aall Index of Investor Sentiment snapped wayyy back from week ago levels.
A week ago, Bullish sentiment was 20.9% and this week as published in Barron’s (19th July) the Bullish sentiment exploded to 39.4%. Likewise, a week ago the Bearish sentiment was 57.1% and this week declined to 37.8%. I do not recall seeing a bigger swing in one week.
A website called Market Oracle was cited on Yahoo message board for GLD – – – the date of the link was 17th July and it was projecting much lower levels for S & P, Gold, and Nasdaq (and much higher levels for US$)
Nevertheless the overall tone of Barron’s this weekend seemed very bullish on the market – – the cover featured GOOG and expected very favorable results from IBM, Apple, Microsoft.
I am firmly committed to bearish camp, but bear hopes have certainly been dashed many times before, so sort of numb to further disappointments.
Yes indeed Geoff. Bear hopes have been dashed many times. Seems like every time the bears think think have the market cornered there is a huge upside reaction rally to cause doubt. I think this time bears will have more staying power though assuming they can get the daily MACD to cross to the downside. If they can it may cause nice cascading momentum down. Seems like we have chopped around recent levels enough and built enough cause for a new big move down.
Interesting sentiment changes. Amazing how quickly that can swing around sometimes.