
I got a weekly confirmed sell on the sp500 to end last week. The weekly candle on the sp500 looks quite bearish going into this week. I suspect we will bounce higher early in the week for a typical mutual fund Monday but then end the week very hard down.
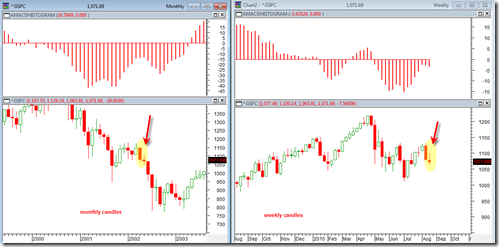
The most recent two weekly candlesticks look similar to two other monthly candlesticks that occurred way back in 2002. I don’t know if they fit a precise candlestick pattern setup but I think the comparison is still interesting.
The first weekly candle was a belt hold candle strong full candle down. Then the next candle was an attempt at a rally but then a failure and showed a topping tail and closed near the low of the candle. In 2002 that led to the next month being hard down.
Since the current pattern is weekly one would presume that the next week will end hard down by Friday.
I think we break below 1063 by end of this upcoming week. Ideally an early bounce this week would not get above the 50 day moving average at 1090.

I really have not talked much at all about the large head and shoulders topping pattern in development. But that is still in play here as well. The right shoulder appears to be on quick formation now and should slice through the neckline as a break of support.
Elliot wave theory predicts a third of a third on Monday touching 1085-87 then a sharp move (iii) down possibly late Monday or Tuesday!
NASDAQ daily has a similar candle pattern after the April top, and this past week.
I know we all hate to look at the fundamentals BUT the revised 2nd Q GDP may just take the breath out of the market. The revision is due this coming week. Economists are now looking at a revision from 2.4% growth to something around 1%. That is a shocker!!
I don’t think the general media nor the public are ready for this! It really points to a double dip or worse that we are spiraling down in a never ending recession!
This may be the trigger we have all been looking for as confirmation of our technical indicators which have been flashing that this market is going to drop off a cliff this coming week.
Interesting JR. I don’t follow Elliot wave that much but I am familiar with the basic counts and I know that 3rd waves down can be the most persistent and severe. So it would seem to fit the bearish picture for the next few weeks. Lets see if the bears can really take charge this week instead of these seemingly endless end of day reversals…
I think the GDP comes out Friday? I just hope their expectation is not too low… But you could be right about it being a deal breaker..
Barron’s 23-August 10, reports in “Market Oracle Checks Out” that the 50 year old blind man (Miekka) who founded the Hindenburg Omen sold out of his stock positions. The Omen was triggered Aug 12 and was reconfirmed with another signal this past Friday 20-Aug.. Miekka apparently likens his HO to a tornado siren. . . a tornado is in the area but may or may not hit. Barron’s reported that Miekka got similar HO reading before the 2008 bear market but at that time he did not sell completely out of his stocks. Apparently this time he did.
It is a neat analogy – – a tornado siren – – still a low probability that a strike will occur, but siren sounds anyway. Seems very realistic.
Yes I have been reading up a bit on the Hindenburg Omen last few days. I made the mistake of just shrugging it off when someone commented about it a week ago.. I was unaware that it had such a reliable record which is interesting. It sure does seem to fit the technicals for a drop. But as I understand the timing of the resulting decline can take from 1 day to 4 months or slightly more. I prefer to see it happen in 1 to 3 weeks given all the technicals setup the way they are right now.
in response to your comment quote:
I suspect we will bounce higher early in the week for a typical mutual fund Monday but then end the week very hard down.
The most recent two weekly candlesticks look similar to two other monthly candlesticks that occurred way back in 2002.
unquote
I have no idea why you say you suspect bounce higher yet u draw comparison to “similar” weekly candlestick in 2002. #1 the next weekly candlestick in 2002 indicated no action above the close of the prior wk’s candlestick, so than why would it be similar – – there was no higher bounce in 2002? #2 were the fundamentals of what happening in 2002 relevant to today / 2010 – – i think we are in a much different place.