
The chart of the German DAX was always the chart that has kept me skeptical about a ‘super bear’ in our own markets. During all the volatility between April to July 2010, the DAX was always just consolidating and very resistant to breaking down. This was a huge red flag to those that were looking for our markets to fall apart because of the so called European debt crisis.
If things were so bad in Europe then why was the German DAX trading so strong? Probably a lot of it had to do with the plummeting Euro making German goods more competitive price wise.
I have to admit that to a certain degree I was in a large state of denial when I occasionally looked at the German DAX index. Interestingly I don’t recall ever doing a post on the German DAX or including a chart of it either. Perhaps that was because I did not want to believe what the chart was telling me. It was telling me that the mega bear scenario was a farce and that it would be very prudent to respect potential bullish scenarios.
So, lesson learned.

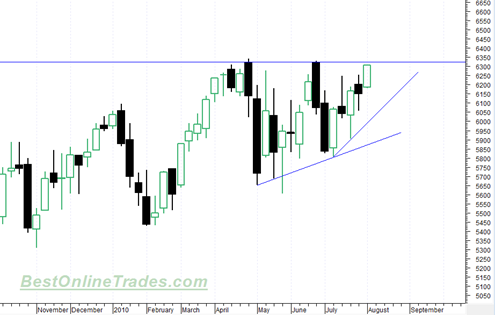
The weekly chart of the DAX currently has a bullish weekly MACD buy signal and from the looks of this chart is within inches of hitting a new 52 week high above 6330. It may not succeed in doing so right away. It could pull back to one of the two blue uptrendlines seen in the chart above and still remain long term bullish.
Looking at this chart tells me the odds are quite good the sp500 blasts higher in the days and weeks ahead back up to the April 2010 highs.
Britain’s FTSE 100 is also shaping up quite bullishly although not nearly as good looking as the German DAX. The FTSE 100 is perched right under its well defined bear market channel line and looks to move up over it soon.