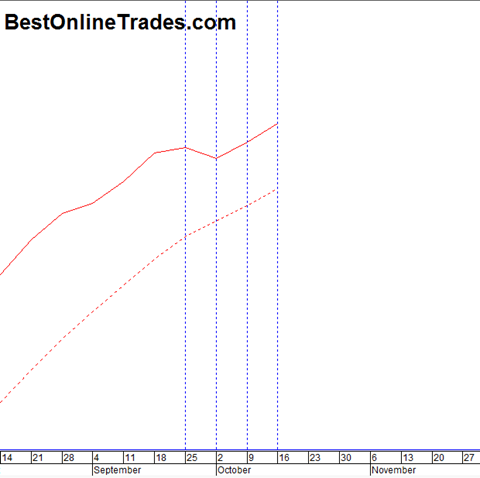
I continue to believe that it is a mistake to even THINK of going short until we start to see some early signs of a bearish weekly MACD downward cross. At least up until last Friday, the weekly MACD has not moved into such a stance yet.
It is going to take price closings on the SP500 that are either flat to down to start turning this indicator in a more bearish stance and remember we are talking WEEKLY closing prices, not daily.
Going short before this occurs in my opinion is a mistake because it is a gamble that we will have a confirmed direction change instead of actually getting a confirmation of one from this weekly MACD.
Analyst after analyst has been calling a top week after week recently trying to be a hero. I admit I was doing the same thing also for a short period but then I decided to submit to the discipline of the weekly macd and I found peace. I was also going short for about a one week period using the TZA ETF (The triple bear ETF) and LUCKILY I was able to scalp a few percentage points from it. It was during the period September 25th to October 2nd which on the chart shows as a slight one week down turn in the MACD signal line (the red solid line).
In the 1975 period after the mega rally the WEEKLY MACD also pin pointed the top and the top was preceded by a HARD TURN down in the weekly MACD signal line that brought the solid signal line close to converging the red dotted moving average line.
The vertical dotted lines in the chart above show the weekly time periods and I am able to zoom into this indicator and precisely see the tape action and subsequent effect on the solid MACD signal line as each week closes out.
When I see enough evidence to support the conclusion that we have made a real weekly MACD bear signal I will post a picture that looks something like this:

But we do need to keep in mind that a MACD weekly bearish cross does not by itself guarantee very significant downside price action.
For example during the 2003 to 2007 recovery rally there were plenty of times when the weekly MACD did bearish crossovers but they never really had too much meat to them in terms of price downside.
However in this case I believe we will have at least 10 to 15% downside price action to look forward to that lasts from 1 to 2 months as the worst part of the decline.
I am basing that conclusion on the speed of this rally, the nature of it being in the category of an automatic rally and the similarity analysis that I believe exists between our current market and the 1975 rebound rally.
Stay tuned to BestOnlineTrades for updates on this all important signal!

