
Today was only slightly down on light volume. We did however confirm yesterday’s doji candlestick (by closing under it) as a reversal candlestick and someone emailed me that there was also a ‘bearish meeting lines’ candlestick formation on the two previous days candlesticks. So both of these appear to be confirmed today.
However despite today’s decline I still do not have a confirmed MACD histogram sell signal on the sp500. That confirmation would come with a close under 1103.11 during the next couple of days.
Today we did get a confirmed bullish MACD histogram buy signal in the VIX (volatility index) and seems to suggest that an upward momentum turn in the VIX is on deck the next few weeks.
I was watching Apple Inc AAPL today and I noticed that today it tested its big earnings candlestick on 50% lighter volume and closed back under that high. That is a daily volume sell signal and should suggest that AAPL has topped out here and should head back down to the bottom of its recent swing trading range near the 240 range. Not to say that AAPL is the entire market, but to a certain degree it has been preventing the Nasdaq from falling apart. The QQQ’s failed to trade higher than the apex of its symmetrical triangle today and still continues to be a good guidepost for the rest of the market.
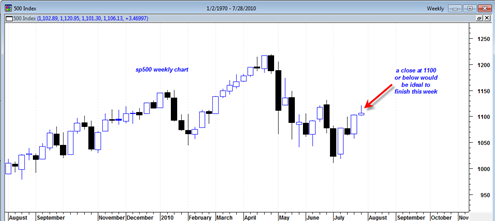
A close under 1100 on the sp500 by the end of this week would go a long way towards setting up a hard down follow on week.
The weekly price chart of the sp500 shows that we currently mid week have a possible hammer reversal weekly candlestick. The sp500 during the next two days ideally for the bearish case need to close where we did today or slightly lower near 1100 to keep this bearish weekly reversal hammer intact.
If we do finish this week in that stance then it would be consistent with a hard down week next week and maybe the follow on week as well into mid August.

To be more strict on the tape I think it is safe to say that the next two trading days really must close very close to today’s level or lower in order for a strong bearish trend change to take shape the next couple of weeks. If the next two trading days close strongly higher or near the top of this weeks range, it is going to limit heavy bearish chances next week.
Technically we are still trading at a lower high 1131.23 (week of June 25th) versus 1120.95 (this week) and I think it is important to keep that stance for the market to have a chance of bearish action next couple of weeks.
The weekly close is pretty much the bottom line. The market could trade higher tomorrow, but then ideally Friday ought to make up for it and retrace the gains and ideally get back into the 1100 range or lower.
Very interesting commentary by David Banister on Kitco today (29-July at 12:30pm). A short read – – he says he doubts that 1010 is the bottom in S & P – – he conjures maybe 950.
Also he posits that gold may have yet to go down to $1040. I think entirely plausible. Coincidentally, that is the price that India Central Bank bought 200 tons of IMF gold about 9 months ago. I think that is gold’s floor barring some really awful / crash type scenario in the overall stock market
well we closed today on S & P definitely below 1103.11. however, i do not put so much in the MACD until a trend has pretty much been in play. . . . meandering around the flat line (zero) is just that meandering / confusing.
here’s hoping you are right with close below 1103!
today was pretty humbling for the bears altho at end of day it was ok
Agreed Geoff. We seem to be overdue for a very big move. I wish it could get kick started already. I know this market has the potential, question is when does it start. One thing I forgot to mention in reference to my SMH post today was that sometimes when price gets back up to the top of the resistance range as it has in the SMH you can sometimes see very fast drops back to the other side of the range because of the large overhanging supply at resistance. This would be especially true during these low volume time frames.