
BestOnlineTrades went long the TZA again today after having closed out the previous position at 7.00 last week.
I don’t normally like to scale into a position or add over time but the way the rest of the market is structured, it seems like an ideal risk reward setup right now. We have already snapped back up to a Fibonnaci 61.8 percent retracement of the mini crash last week. The rubber band seems to have stretched too far in the opposite direction and I suspect it will move down again to fill the large opening gap in the markets from the Euro bailout. If the TZA falls lower in the days ahead I will likely add to the position taken today.
Getting a very clean entry in the currently very fast moving markets is not an easy task. Also the extra volatility makes it necessary to widen protective stops and give allowance for larger draw downs. Getting a clean entry during a panic spike in the market is almost impossible if one is not prepared.
Buying TZA on breakouts is a recipe for disaster because of the extreme swings down it has during pullbacks. Better to accumulate it during pullbacks with the confidence that broad market upside is limited at this point.
I think there is an outside chance the SP500 could still trade to 1180, but for now I view that as a remote possibility.

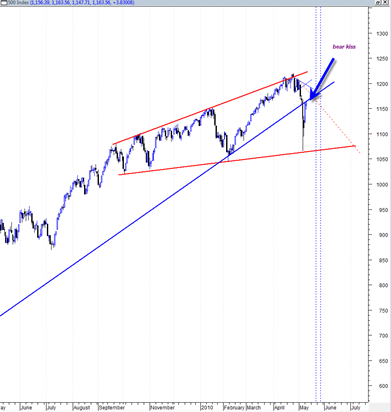
Today’s intra day reversal at the end of the day has me thinking that the market may form a symmetrical triangle from here that coils the market up into a low volatility state.
I cannot rule out that the market just gives up and falls hard down from here and does a quick retest of recent crash lows. But for the now preferred scenario is for the market to pull back tomorrow and then continue to form a coil or symmetrical triangle for an eventual resolution later in May.
It is really a tough call.
On the one hand I could speculate that the market will continue a severe plunge right down into the May 23rd to May 27th date. On the other hand we could rally right up into that date before turning down again..
Which one is correct ?
We will have a much better idea by the end of this week.
Note the solid blue uptrendline in the chart above of the SP500. You can see that the SP500 has rallied right back up to the underside of the broken trendline today. I should note that this retest or ‘kiss’ of this trendline was done with much lower volume. The volume was relatively weak today compared to the mini crash volume we saw last week.
The high volume break down through the blue uptrendline last week pretty much sealed the case that we are now in a new bear trend.
Long the TZA and adding on dips…