Most of the time when I write about the gold price it has to do with near term and intermediate term timing. Recently I indicated that gold needed to break out north out of its rising wedge formation in order to maintain a stronger bullish stance. This has clearly happened and gold continues to surge higher.
On a short term basis it is very overbought and due for some type of correction, but it is likely to continue to have a strong bias during this typically seasonally strong time frame.
For those who have been in the gold market since the early part of the 2000’s, one has to wonder if they have any type of exit plan or just plan to hold gold for the next decade without a care in the world. Buy and hold has certainly been working very well since 2001 but I can’t help to ponder the question whether it is wise or not to try to time the first major top in the gold price.
The gold bull market has been very slow moving but it appears as though it is about to speed up into a final blow of phase that may peak in end of 2011 time frame. So we are talking roughly a year and a few months.
I think a double from here is achievable, so somewhere between 2000 to 2600.
So the question again is… is it worth it to attempt to time this market to try to identify the first MAJOR intermediate term top in the gold price that could lead to a 50% downward correction that lasts 2 to 3 years ?
Another reason why I have been thinking about this is because my father has some gold bullion bought back in 2004. I have asked him several times if he has any exit plan and I never really get a clear answer. More or less he views gold bullion similar to house ownership, in that it is typically not traded very often and held through good and bad times.
But I cannot help thinking how potentially disappointing it would be to ride the gold bull from 250 350 450 or 550 all the way up to 2200 to 2600 and then after having made such a huge gain, go through the long painful 2 to 3 year process of a 50% down move from 2200 to 1100. A 2 to 3 year 50% decline in the gold price may not seem like a big deal, but when it occurs over a 2 to 3 year time frame it can be very discouraging, and possibly shake loose even the most die hard gold bulls.
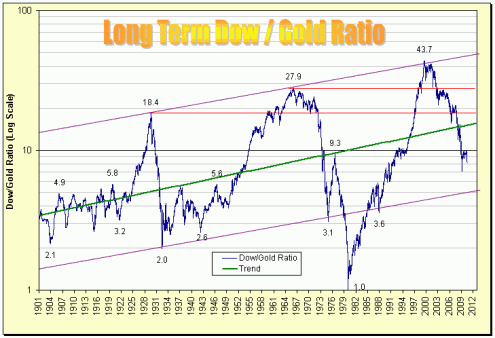
Once again I have to refer to the long term Dow/Gold Ratio chart which should be able to nail the first major top in the gold price. And the work that needs to be done is really quite simple. This avoids having to time the market based on daily weekly or monthly swings which can be quite difficult to say the least.
It looks pretty clear to me that a 5.0 ratio is number needed for the gold bell to start ringing in the top. The above chart is extremely long term, so it is not going to change very fast. In that regard it should provide an excellent much longer term sell signal.
The 4.9 ratio value would but the above blue line right at the bottom of the very long term channel. The last two times down at that level led to a huge upside correction in the ratio.
So I am thinking somewhere near a 4.9 ratio value is going to be the ideal range to bail out of all gold. Then all one has to do is just sit tight and wait for a huge downward correction in gold probably near 50% that will allow one to accumulate again at a 50% sale price for the eventual final mega leg up into the 5 to 6000 range many years later.
So all one has to do is simply every few months divide the current DJIA price by the current spot gold price. Currently the DJIA is 10858.14 and the current gold price is 1309. So 10858/1309 = 8.29.
Many months down the road when that ratio value turns into something close to 5, it will be in my opinion a very good longer term sell signal and a time to stand aside, in the belief that a huge mid term correction is likely to start. This may happen by the end of 2011, but that is just a guess for now.
The interesting part of the ratio is that if the DJIA keeps rising it is going to take a much higher move in the gold price to get the ratio back down to 5.0 range. For example if the DJIA gets to 14,000 then it is going to take a gold price move north of 2600 to get the ratio down to near 5.
A great way to remember to calculate the DJIA/Gold ratio is to set up a google calendar periodic email reminder every few months. Or you can simple stay tuned to BestOnlineTrades :). When I see this ratio come into the 5 range I am going to blast sell signals all over the site that will be hard to miss. . .

