
I already talked about China Agritech Inc. yesterday. But I wanted to post this semi-log chart which more clearly shows the juncture this stock is at right now. It did break down today and pushed the RSI below historically supportive levels which is a concern.
Also, based on the chart below there is at least the potential for a head and shoulders topping pattern that could be forming. The pattern can fail as well, but if it is a valid pattern then China Agritech should break down within the next week and a half time span.
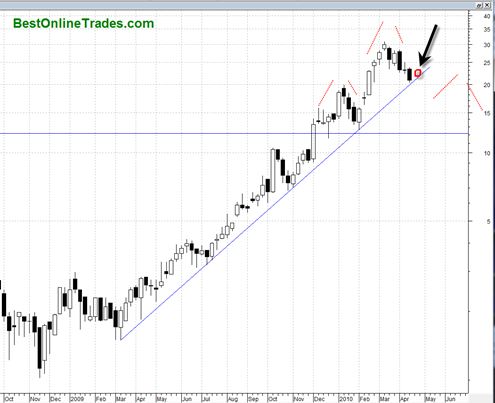
If the pattern is not valid then the failure should also be indicated within the next 1 and a half weeks. The best bullish scenario is for CAGC to hold above 20 by the end of this week and then hold 21 by the end of next week (the red square drawn on the chart below).
If after the end of next week price is still drifting around the 20 range then this entire uptrend is in serious doubt in my opinion.
