Monthly US Dollar Chart Indicating it May Break Down Severely in September

monthlyusdollarindex

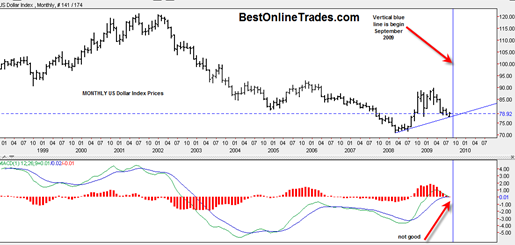
I have some new information on the US Dollar index and wanted to bring it to your attention.  My obsession with the US Dollar Index continues… But why? Why am I so obsessed with the US Dollar Index.  I am because it is either going to help gold do a MEGA breakout or it could potentially hinder any breakout in gold or even cause a break down.

I just wrote a post on the negative seasonals that are kicking in for the US Dollar Index starting right now.  But I only just now discovered a new perspective on the US Dollar Index that is giving me a little extra dose of confidence that we could see the US Dollar break down severely in September and subsequently cause the gold price to spike to a new all time 30 + year high.

Read more

SP500 about to get a Bullish Monthly MACD Buy Signal

sp50020090811

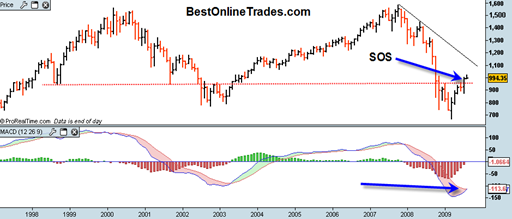
The SP500 is about to get a bullish monthly crossover on the MACD indicator, a popular moving average combination indicator that can become very useful over longer time frames.  The monthly MACD signals can signify new major bull or bear market moves with sometimes 1 year or more duration.

The current daily MACD signal is starting to flash some near term sell signals and could set us up for a move to test the 940-945 range on the SP500. 

It is confusing sometimes when you have a sell signal on one time frame and a buy signal on a different time frame.  To help clear the confusion, I always keep in mind that the longer term time frames have precedence over the shorter ones.  So while we could get some selling pressure into 940-945, we must remember that the longer term signal is indicating higher prices.

Read more

What would cause the Gold Price to go Truly Parabolic ?

usd20090805

Have you ever thought what might cause the gold price to go truly parabolic (aka vertical) ?  It seems that the personality of the gold price is one of parabolic structure.  That was the case in the 70’s and so I see no reason to believe this will not be the case now.  It probably will.

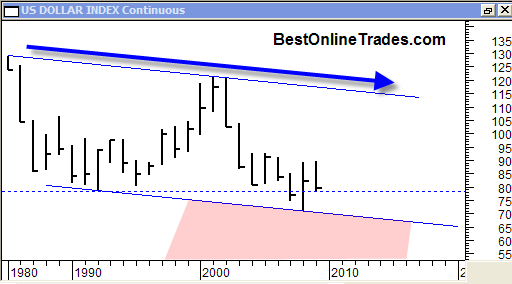
The chart above is the US Dollar Index chart plotted with YEARLY price bars.  It should be quite clear that this is a very long term price chart since it takes a whole year just to complete one price bar !

Read more