During the height of stock market volatility it can become very difficult to keep a clear mind and separate the hype from reality. The hype comes in from the TV networks and the pundits who provide business fundamental news. The problem with this type of information is that it is difficult to consume because it is not tangible enough. There are wide ranging theories and expectations and fear tends to feed on itself and accelerate which causes feelings of panic and difficult decision making.
The nice thing about stock price charts is that they provide something tangible to examine so we can at least develop some type of expectation of what might happen and modify our behavior accordingly no matter what is happening in the ‘news’.
I suspect there will be some type of big headline over the course of the next 6 trading days or maybe even over this weekend. It may be a HUGE headline. I do not have a clue in the world what it might be or even if it will arrive in such timely predicted fashion.
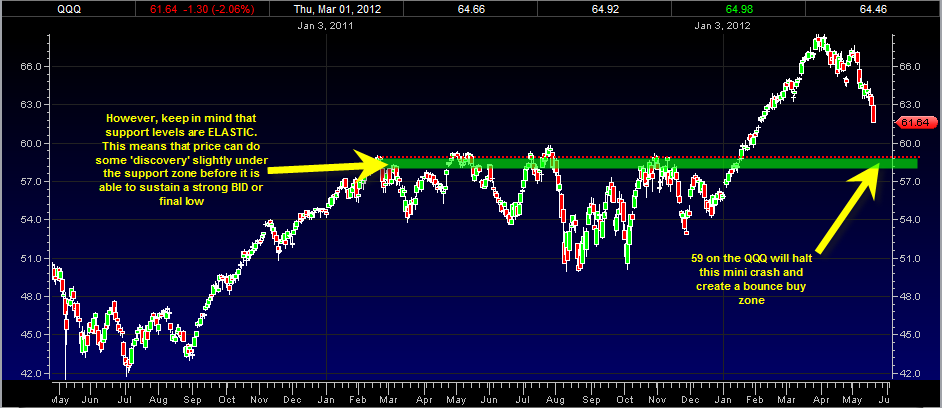
Looking at the QQQ Nasdaq 100 index ETF chart we can see that the QQQ is fast approaching the key 59 support zone.

I expect that when/if the QQQ reaches the 58 to 59 zone it will mark an interim bottom for the current mini crash in the stock market. The green shaded area is the rough zone of support where we could see price trade ever so briefly before jumping back up to 59.
The 59 support zone in the QQQ is a supporting zone that had 4 previous peaks. It is quite a solid support zone and I would be quite shocked to not see a bounce from this zone.
Because of the current stance of the RSI (relative strength index), it could be that a testing of the 59 zone will be an intra day type test where the market touches it and then ends the day with a strong reversal.
This is the type of chart that helps to keep you clear minded when the @#$%@#$ hits the fan.
Note that in the 2011 August time frame decline the QQQ fell right under support without even stopping, but it did rally back up and over the support zone eventually.
I can’t predict whether the 58 to 59 support zone would fail as a support zone. However I will say that the overwhelming odds favor that this zone will hold as support and lead to a sustainable upside bounce and rally.
Right now the relative strength index reading on the QQQ is 24.79 which is already quite an oversold level for the market to be in.
I have been able to calculate that if the QQQ reaches the 58 level it would equate to an RSI reading of 16.07 which is extremely extremely oversold reading. So this supports the thinking that the 58 to 59 zone will halt the current decline and allow the market to bounce.
So I will say that the 58 to 59 range on the QQQ should be watched closely as the capitulation point for the current decline. This may occur by the end of next week or earlier.
Because of the extremely 16.07 RSI reading that the 58 level represents, it seems quite a good chance that the market would only briefly trade near that level and then form a strong intraday bounce.
