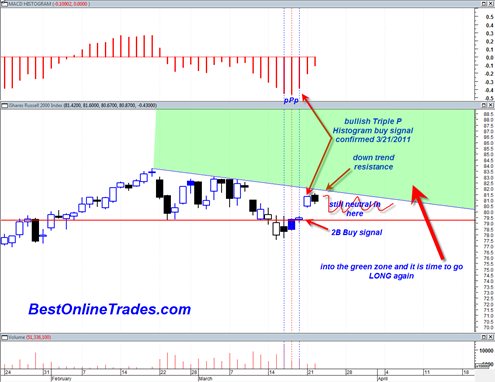
The Russell 2000 during the recent ‘earthquake’ correction has held up surprisingly well. During the midst of the correction I had eyed the Russell 2000 several times and it bothered me from a bearish perspective that it was not breaking down from support. The decline was too weak.
So sure enough now we see the IWM Russell 2000 small cap ETF blasting back inside the range having created a 2B Buy Signal and a confirmed daily MACD histogram buy signal.
Like an animal trying to find its way out of a cage, the IWM is now once again near the top range of the recent pattern and it must make a decision whether to initiated a northward breakout or fall back within the neutral range and then decide later what to do.
I have seen this type of chart setup many times in the past and it looks to me like a northward breakout will come soon, perhaps by this Friday 3/25/2011. The IWM 2 month pattern looks once again like the typical sideways type corrections that we have been seeing frequently in recent years. These sideways corrections, that show an inability to get real % damage to the downside are the most bullish type of corrections.
I am not tipping my hat 100% to the bulls here yet. There is still a bearish opportunity in the IWM. We will just have to see how the tape evolves for the rest of this week.
The green shaded area in the chart above is where we could see an upside acceleration. The neutral zone is also indicated and the solid red horizontal support line of the recent correction. It will be very interesting to see how this chart resolves by the end of this week. I will do an updated version of this chart when I see something timely occurring. . .

