
I just drew up a quick longer term chart of the sp500 and I think what could be building here is a large head and shoulders topping pattern which could suggest that the most devastating price action will occur in the July to September time frame of this year.
If I have drawn this pattern correctly then we will see 1044 range or so on the sp500 in the days/week ahead which should mark a significant BUY point as the beginning of the right shoulder formation.
The right shoulder could take a month or more to form.
If this pattern does develop what it says to me is that the best shorting opportunity is still a few months away.
Right now as I write (10:43 AM May 19, 2010) the market is playing the same HEAD GAMES it did right before the 1000 point fat finger crash on May 6, 2010. On May 6, 2010 the market STARTED trading most the day as a small DOJI candlestick and this is what it is doing again now. It is being very deceptive! It may pull the same hat trick today as it did on May 6, 2010.
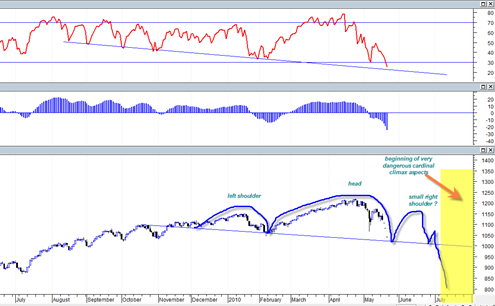
Anyway here is the head and shoulders chart I was referring to above:

Those dots three dots are price closes that I have added in to fill out the indicator patterns. A drop to 1044 range would put RSI (relative strength index) in a supportive stance relative to all the previous declines since July 2009.