
In a previous post I mentioned about how the market is likely to transition from a high volatility (fat finger May 6, 2010 mini crash) state to a low volatility state. With the indices barely unchanged on the day so far I think it is safe to say that we have made that transition successfully.
The volume picture today so far is interesting because it is once again coming in very light. Very light volume by itself is meaningless, but taken within the context of a sharp market rally back up to head and shoulders neckline resistance, it then becomes very meaningful.
As I write this, the market has not closed for the day yet, however it appears possible that we may get a confirmed volume sell signal by the end of the day as long as the SPY SPDR S&P 500 ETF closes under yesterday’s high of 117.62.
The daily candlestick for today is showing an indecision doji and can be interpreted two ways. Either it is a pause in the current uptrend before moving higher, or it is a confirmed momentum turning point in the market. The low volume snap back rally back up to head and shoulder neckline helps to give this doji more of a reversal indication instead of ‘pause in an uptrend’ indication.

Have you ever been to an airshow and seen those stunt planes fly their planes straight up into the sky in complete vertical fashion?
It really is quite interesting to watch especially when the plane reaches a point of near equilibrium from its upward moving force matched against gravity.
At that point is seems as if the plane is literally just floating in the air until it slowly starts to turn down and sucuumb to the forces of gravity.
My sense right now is that the market has the feel of this plane at its point of equilibrium and that it will soon swing down again.
But how far down will it swing ?
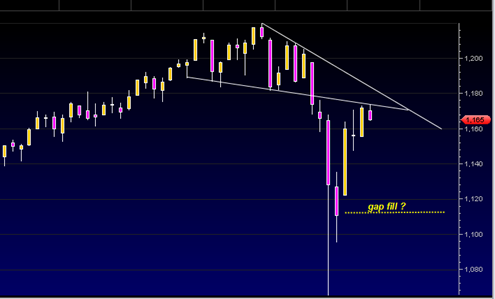
The very large opening EURO GAP at 1113.01 seems like a logical first target to me. That was a government manipulated opening gap and it would seem the free market would want to fill that gap.
That gap on the SPDR S&P 500 ETF SPY was on 396 million shares and so the volume we get on a filling of that gap is going to be a key factor in figuring out if we will be able to slice lower from there now or later. If we fill that gap on much lighter volume, it will warn that the market wants to trade higher again and tread water.

The blowout volume that was created on May 6, 2010 has me thinking lately that this is not going to be able to be broken in a part II crash fashion very soon. Why ? Because it will take a tremendous amount of energy to break through those lows. I suppose it could happen but it will likely take a very significant event to do it.
The more likely scenario is a gap fill and then another bounce back up in the form of a small double top near the 1165 to 1170 level.