Today was an amazing day in the sp500. The index chose to reject the potential bearish engulfing candlestick that we saw yesterday. It looks as though this potential bearish engulfing was a fluke and a possible bear trap.
But the sp500 is not out of the woods yet. Key level for sp500 to break upwards through and hold above is 1330 range. I think it will do it (I am actually pretty confident that it will) but we are only into Tuesday this week. Today’s action was certainly positive in rejecting the bearish engulfing pattern, but ideally there would be follow through rest of this week.
I think the ERX Triple Energy ETF and the NUGT Triple Gold Miners ETF are setting up for another leg higher from here.
I already feel better not reading any more big financial news articles out of Europe. I am just watching the tape action, the patterns and the volume and it feels great. I think it is important for me to remain as unbiased as possible when I try to interpret the next big moves in any market, index or stock. Getting rid of the endless emotional news cycle feels like I have a monkey off of my back. Great!
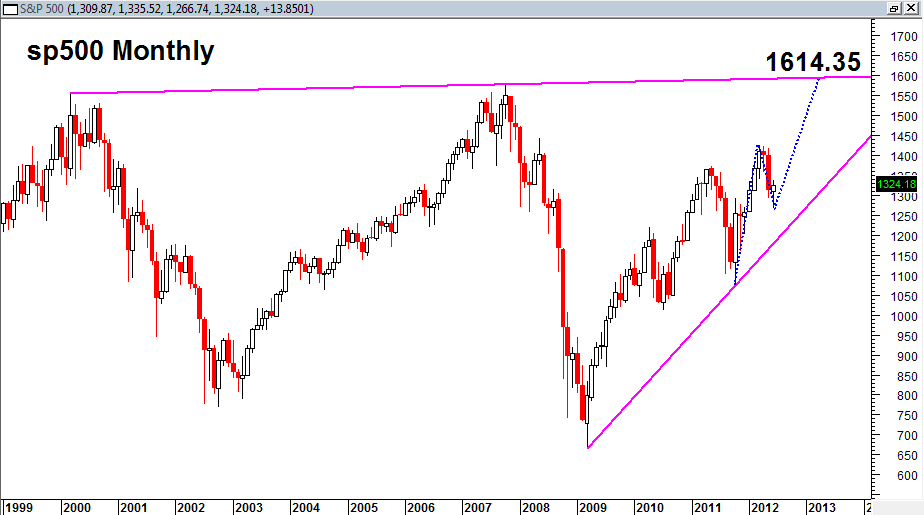
Looking again at a possible bigger picture trend:

Note the very large structure that seems to be compressing towards a 1600 eventual longer term target. What is interesting is that if we calculate a 1to1 A B C D up leg assuming that the June price low was the C point, then I get a projection of 1614.35 which is right near the MASSIVE TOP RESISTANCE line that marks the limiting line of this entire massive swing trading range.
It is also interesting that if we get symmetry in terms of time on the expansion of this AB = CD up leg, then it would suggest that the high near 1600 would come in 6 months from June 2012, or by December 2012.
It is way to early yet for real clarity on this projection, but it would be quite amazing to see 1600 in the sp500.
Assuming the sp500 got to that zone, then would come the question, “Do we break north from the 12 year resistance line or do we REJECT IT again and head down again inside the swing trading range?”. It would be truly amazing if the sp500 is able to break NORTH from the 1600 resistance zone as probably the majority are not even contemplating that type of scenario right now.
I will say generally speaking that a lot of the time, markets and stocks tend to be successful in accomplishing a break out or break down on the THIRD TRY. Clearly, getting to 1600 is the third try since the year 2000. It is something to think about, but impossible to know for now.
P.S. Accomplishing 1600 in the sp500 by the end of the year probably seems absurd. But if you look at the power and strength of the rally that started in mid 2011 one can start to see how a follow on rally might match the original in character and symmetry. Even if the sp500 does not make it to 1600 in 6 months, it will still have plenty of time to do so according to the chart above. In fact it would have all the way until January 1st 2015 to do so.
