
The SPY ETF today once again reacted to support near the 184 zone and managed to close slightly higher for the day. The daily chart of the SPY ETF below shows the current trading dynamics.
 SPY ETF Daily Chart January to April 2014
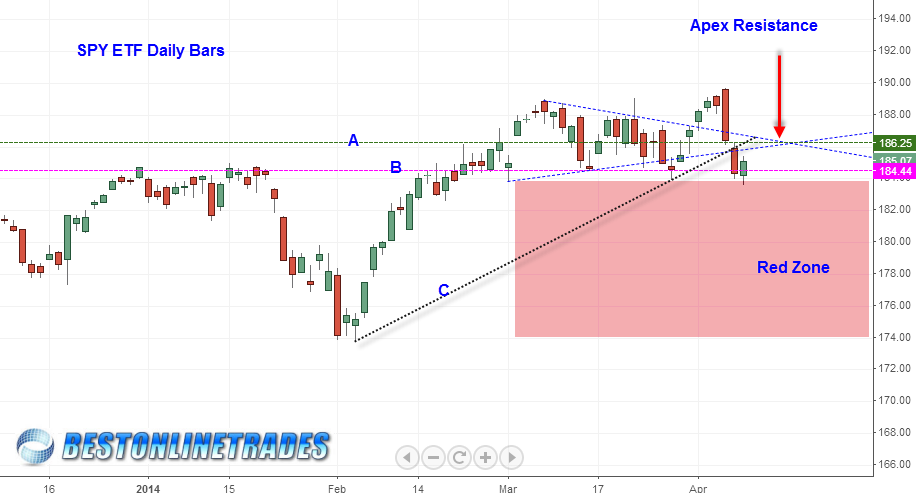
There are a number of indicators that suggest the market has topped out near term and that we are entering at least a 10% correction going forward. However, the best indicator has been and always will be price itself. It is simply the best leading indicator.
Looking at the SPY ETF price chart above it is very clear that the 184 level MUST be broken to the downside before any more bearish scenario could engage during April 2014. Today’s bounce from the 184 is the third time down into this zone (or 4th if you consider the March 1st 2014 drop into the zone).
The 184 level has proven to be an important area from which past bounces have occurred and in some cases very strong upside bounces. I will say that since this is the 3rd time down to 184, my interpretation is that we are spending too much time playing in this zone. The market is getting too comfortable down here and at this point should have zoomed higher off the zone into new all time highs by now. The 184 level is sort of like the forbidden fruit that you are not supposed to be eating.
The SPY ETF needs to get a strong reaction up from here the rest of this week to ‘save it’ from the risk of breaking under it.
Line A in the SPY ETF chart above represents the APEX resistance level which was previously support.
Line C is the up trend line from the critical February 4th 2014 low. We can see that this line C was broken with a sign of strength yesterday, April 7th.
Line B represents the critical 184 support line which must hold to keep the bullish option still open for the SPY ETF. If line B is broken, then it would transfer this key level into new resistance and would really help drive home the more bearish potential scenario. In fact it is an absolute requirement to kick start the bearish scenario.
Any upside bounce the rest of this week should ideally be contained near 186.25 . Even better, holding under 185.78 would be the better choice since that would be a rally right back up to just under the symmetrical triangle pattern (the dotted blue lines).
The problem with these resistance levels just mentioned is that if they are even slightly exceeded it can cause a potential eruption in short covering and add fuel to any meager upside rally. So we will just have to wait and see what kind of bounce, if any, the market has in it at this point.
I will say that the most bearish scenario I can conjure up at this point would be a gap up on Wednesday, April 9th, 2014, to 185.78 and then a sell off during the rest of the day that fully engulfs the April 8th high and low and closes near the low of the day or slightly lower, just under the 184 level.
Lastly I will say that all three previous times the SPY has moved into the 184 level (the first bar into the 184 zone), the next day immediately saw an upside opening gap up and spring higher. However today we witnessed the SPY open very close to yesterday’s close and meander pretty close to the previous days closing range. This could be a subtle sign that today’s upside bounce was only a one day bounce, to be followed by fairly swift market weakness the rest of this week.