
We currently appear to be inside of a slow motion stock market crash that is breaking down from a large broadening top formation as well as a head and shoulders top formation.
BestOnlineTrades issued a BOT short signal way back on July 28, 2011 and since then the market has basically plummeted like a rock. Then more recently BOT has issued a ‘re-short’ signal at 1188 on the sp500. So far so good, but what now?
BOT believes that the best way to trade this crash is using the weekly charts. There is tremendous difficulty trying to trade the daily swings in this market unless you have extremely reliable trading system and very fast fingers and iron clad discipline. I am not saying it is impossible, but I find it extremely extremely difficult.
For example, today we dropped 500 points on the DJIA near the lows. But my speculation is that we will bounce hard up from here perhaps to fill todays gap down or slightly under, not sure. But if I am wrong then one would have to chase a gap down tomorrow but then that could reverse too by end of day and cause total confusion.
It is much easier to trade a stock market crash on a weekly basis and just ride out the minor swings (because there will be plenty of them) and let the market eventually find its ground level.
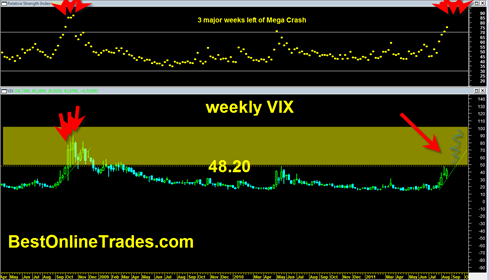
My current take is that ‘ground level’ will be achieved during the next 3 weeks.
I am basing this statement on the weekly chart RSI levels and the current weekly stance of the VIX (the volatility index).
Based on my calculations we should have 3 more weeks of devastating price action that would make up the worst of the current decline phase.
Of course we can decline more than that afterwards, but I am just saying that the remainder decline after 3 weeks is likely to be choppy and much more difficult and create divergences and choppy action.
I am basing this conclusion on a similarity analysis of the 2008 mega stock market crash. Perhaps this comparison is unfair since the speed and viciousness of the current bear trend seems worse than that time frame, but for now I think it is a good benchmark.

The 48.20 level on the VIX is extremely important. I view the VIX initiating above this level as a clear sign that the mega crash portion of the current decline has engaged.
Note that weekly RSI is currently in the bullish POWERZONE where price can trade with extreme momentum. But keep in mind this is a weekly chart, so we are in the powerzone WEEKLY trend.
In 2008 this led to the VIX exploding higher for 3 more weeks finally peaking on October 23, 2008.
Now it could be that we achieve the max decline portion much sooner for the simple reason of hyper momentum to the downside or in a 1 day crash type situation. But for now I am working with the theory that we are due for another 3 weeks of ‘meaty’ type decline action.. then after that it gets much more complex.
So I suggest watching the VIX level of 48.20 like a hawk, because when and if we start to print above that range then we know the mega crash has ‘engaged’.