
It took me a long time to realize that it is often the most subtle signals the market gives you that have the most meaning. The biggest challenge is figuring out what the market is ‘thinking’ at any moment in time. Usually this is best done by looking at the indicators in combination with price itself. I would say that probably more than half of the time, the daily price signals themselves give enough information combined with volume. But still, that is not enough. One has to add in a little bit of intuition and gut feel on top of everything else. And that seems to get better with time and after looking at enough price action on many different charts.
The long legged doji candlestick we printed yesterday on the SP500 was supposed to result in some sort of northward follow through today, but it was not to be seen at all.
During the bull run between March 2009 and April 2010, it seems as though every single reversal doji like that resulted in northward action almost immediately.
Today that was not the case at all. In fact the market in the early part of the day did get a little bit of a rally going but it was really a weak attempt. I was looking for 1150 or even a huge squeeze all the way to 1170. Making it to 1170 would have formed a small double top formation that would have been consistent with the initial 1930’s automatic rally breakdown and then consolidation.
Instead, today we failed on the follow through and we also retraced much more than 50% of yesterdays long legged doji candle. In fact we almost retraced all of yesterday’s candle. This could be a Hound Of The Baskervilles signal today which basically means that the market has done the exact opposite of what was expected to happen and should have happened. And therefore in my opinion we need to be open to the idea that because of this failure we should expect heavy downside action into the end of this week, perhaps climaxing on Monday, the 24th of May 2010.
This is not the type of action you want to see if you are long this market even for the short term. The volume for the day was heavy enough to signal to me that we could get a downside break through tomorrow and build enough energy to blast through the May 6, 2010 swing low. But still the target should be near the 1044 range on the sp500.
I suspect that we will see some ‘throw under’ on the major indices if we do get another mini panic. It is extremely difficult to trade these mini panics once they are already set in motion because the market moves so fast.
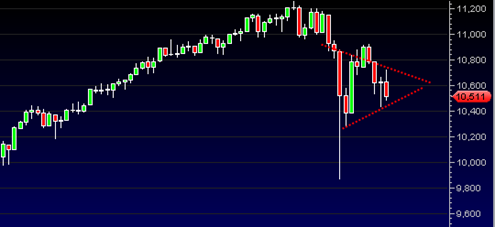
 I also mentioned in previous posts here at Best Online Trades that we would most likely see one of 3 possible consolidation patterns in the market after the May 6, 2010 mini crash. A rising wedge, a symmetrical triangle or a W bottom with an extended right handle. It appears that the market chose to create a symmetrical triangle or coil. This pattern is most effective if price does not extend too far out into the apex of the pattern. If we get a break down through the pattern tomorrow it would be ideal timing. A rally tomorrow back into the pattern might weaken its prospects.
The jig is up and I suspect we will get the next leg down over the course of the next 3 to 4 trading days. It really does appear now that the market wants to trade right down into the May 23, 2010 astro date. I suspect the market already knows what the ‘news’ is going to be on or near that date and is likely in the process of selling the news already…
So I am looking for a situation of the market finding support on the ‘news event’.