
This may be the most significant post I have done in a long time here at BestOnlineTrades. I can smell a big drop coming, I can taste it, see it and feel it in my bones. This is how the trading dynamic is setup up right now. Let’s not forget how the first flash crash on May 6, 2010 started. If you were looking at it real time you could see that it started as a simple calm looking DOJI candlestick but then transformed into a monster in minutes.
This may be what transpires over the next few days. CALM teasing action to tempt the bottom pickers and the technicians into going long because the market is ‘oversold’, but then the bottom falls out seemingly out of nowhere.
Today’s tape action in the market may have provided the final nail in the coffin of evidence that we are about to plunge badly again, possibly in crash type fashion or just continued waterfall fashion with huge swings in both directions but ultimately a lot lower.
Make no mistake about it, I am extremely bearish on the market right now and today’s tape helped to remove any lingering doubts I may have had. I see the market at a juncture right now where it must blast higher by several hundred Dow points, otherwise it will totally collapse. That is how well defined it looks to me right now. It is either or, and nothing in between. If I am wrong here then I will be wrong very badly and we will see this market shoot higher very fast and very wide. If I am wrong, then it may have to do with volume, because the volume was quite light today and makes downside follow through look suspicious. However the low volume is consistent with the symmetrical triangle pattern and descending triangle patterns I have alluded to before. So you can see a surge in volume come out of nowhere from these patterns.
If yesterday’s candlestick was to be a reversal hammer then today’s follow through was horrible. If you are a bull, it is not the type of follow through action you want to see. I realize that one days price action does not define the entire market, but sometimes one day signals can provide a huge clue about forthcoming price action.
Today’s price action reminds me very specifically of another days price action that occurred in 2008 (I can’t believe I can remember a day of price action that far back!). I remember that day very clearly because it was a one day reversal signal that was very meaningful. I remember calling my father on that day in 2008 and talking all emotional about how bad a day that was and that it could have very bad implications for the next few days or weeks of trading. That one day made me extremely bearish about the short term prospects for the market.
Look at the chart below to see the day in 2008 I am referring to:

Note that in the chart above I indicate that if we get a similar decline to the 2008 period from this point onwards, it would lead to a final target of 804 (on an intraday basis, not necessarily closing value) on the sp500 possibly by end of next week or June 25th, 2010 at the latest. This 804 number probably seems absurd at this point right? It really does in the context of the trading range we have been in, but you just have to look at the current price chart of BP stock to see how ‘absurd’ can continue for a while when the sentiment is heavy enough.
It is very interesting to me that the RSI values in the chart above are almost identical. In 2008 RSI was roughly 37 and by today’s close it is also roughly 37. It is amazing to me that we have roughly the same RSI values at roughly the same point in time on these trading structures.
I went 100% short today after sitting on the sidelines the last few days. My preferred way to short the market is with the TZA Direxion Daily Small Cp Bear 3X Shs. What is interesting about the TZA is that it has this ascending triangle type structure since early May 2010. It is a nice structure to have especially if you are bullish on the TZA because it is basically saying that with each new minor pullback you will have new buyers coming in who are more willing to take a shot at breaking overhead supply line that makes up the top part of the ascending triangle. So TZA looks like an outstanding buy to me right here and if it gaps up tomorrow it is still a buy in my opinion.
In a previous post I was talking about how when RSI (Relative Strength Index) breaks below the 30 level it can move a stock or index into the ‘power zone’ where you have wide price spread and sometimes a panic. This can lead to capitulation price action that marks the end of the previous strong trend. But sometimes it just leads to more continuation in that direction.
The opposite that can occur is of course an RSI breaking above the 70 level. When stocks or indices do that then they are in the ‘power zone’ of strength and you will see very minor pullbacks and amazing price strength.
So my take is that we are about to enter the ‘power zone’ below 30 and it may lead to a huge down move. How large a down move is of course the open question, but given the weak persistent tape action of late it seems like we have a pretty big capitulation coming. And the truth is that we have not really had a true capitulation yet to flush everyone out. We have not had that one day that basically says to everyone, “Oh my God this is horrible, its all over now.”
I have been going back and forth in my own mind trying to figure out whether we get a cascade 1930 style drop, or a quick and dirty 1987 drop. I cannot seem to make up my mind. The similarities to both chart structures are astounding (in 1930 based on daily and in 1987 based on the weekly). I guess we will just have to let the market day by day give us the clues. Lots of intraday reversals and some flat trading days will say it is a 1930 repeat, but very hard down persistent closes day after day tell me we are in for 1987 part II.
Here is a chart of the QQQQ’s again which I mentioned before are providing outstanding guideposts for this market. By the way, the AAPL weekly chart is showing a bearish divergence now as well and we may see AAPL finally start to break down for real to finally get the Nasdaq moving down for real this time.

This QQQQ chart is an outstanding guidepost for me right now and it is confirming what I am seeing in the first chart in this post. Today it basically is telling me that it attempted to get back inside the triangle, but then failed at the end of the day and also engulfed the previous days reversal candle. Not a good sign if you are a bull !
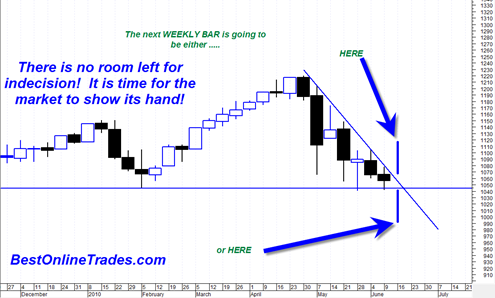
My WEEKLY chart on the sp500 is telling me that there is ZERO WIGGLE room right now and my favorite WEEKLY momentum indicators are saying that the epicenter of the decline should begin either by the end of this week or definitely by the next full trading week (next week).
You want to see what I mean by ZERO WIGGLE ROOM ?
Take a look at the sp500 index chart I have drawn in with defining resistance and support areas:

You can see clearly from this chart that the market is at a juncture where it will either blast higher very strongly, OR blast lower very strongly. No room left for indecisiveness!