
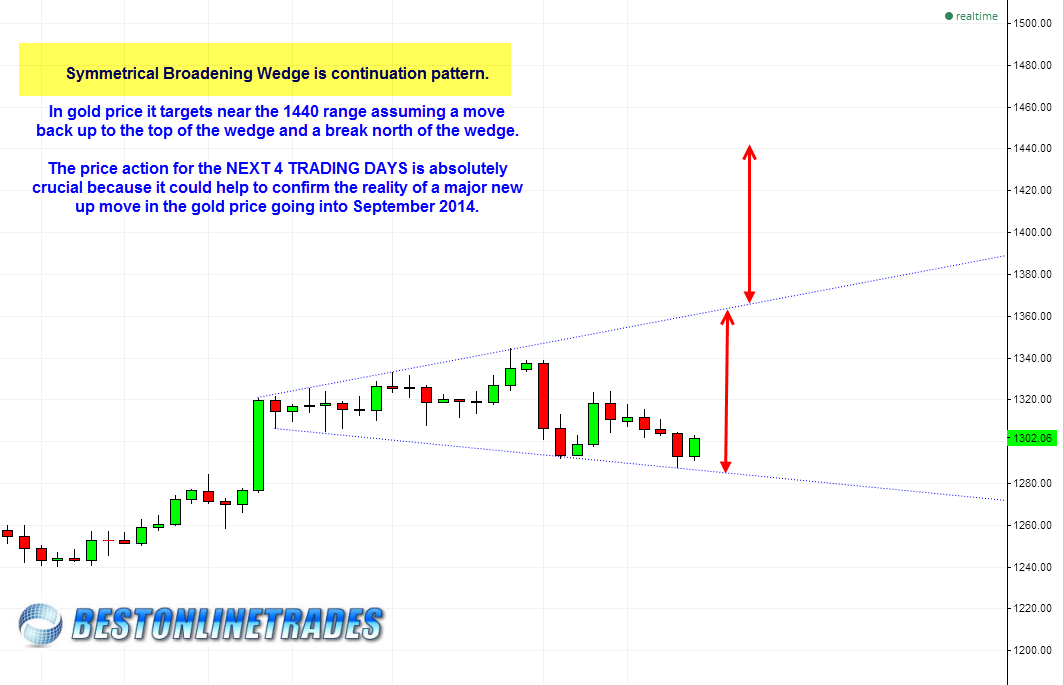
The gold price is trading in what appears to be a symmetrical broadening wedge formation. This pattern has the potential to manifest itself as a continuation pattern with an upside measurement. My current view is that it will resolve to the upside and reach possible targets near 1400 range.
There are a few things that have developed in the gold price as of late. First on the 4 hour price chart the gold price has recaptured the 1300 level which is psychological important. Not only did it recapture it, but it did so in the form of a 2B buy signal relative to the previous swing low of July 15th, 2014.

The NEXT 4 TRADING DAYS are absolutely crucial for the price of gold because we finish the MONTHLY July price candlestick for gold. A strong move up into the end of the month would help paint the monthly chart very nicely and help the argument that gold will continue to skyrocket into August September 2014 time frame. If you are bullish gold then you want to see a very strong move into July 31st 2014.
The pattern above allows for such potential, but we will just have to wait and see how it evolves.
Interestingly next week we have the Fed Meeting mid week and we also have a potential Argentina debt default on Wednesday. These two items are of course entirely speculative and I have no idea whether they would lead to an outcome that is bullish for gold. But during the last Argentina debt default in January 2002, the gold price surged about 4%. Oh yes, I almost forgot I believe we also have GDP result coming out next Wednesday as well ! So we have 3 potentially highly charged fundamental events that could trigger a massive short squeeze higher in the metals.
The modus operandi for forward looking news events is for them to be typically bearish gold and then give the stock market a renewed bullish bias. Maybe it will be different next week? Maybe we will see an A. Argentina debt default B. Then a fed meeting result that shocks stocks and is somehow bullish gold and then C. A GDP result that is much weaker than expected and destroys the case of ‘A continued strengthening economic expansion’.
If the above chart bullish bias is correct then it would seem like one or more of next weeks potential trigger events gives a bullish bias to gold…