
After letting the market action ‘soak in’ after the last two days I am coming to the conclusion that we will see two possible scenarios next week.
The first one is that we do not head down immediately next week or even mid week and instead tread water slightly higher or even into a new very marginal minor high that exceeds the 5/13/2010 price swing high. This type of range bound trading action could take the shape of a symmetrical triangle formation that coils up the price action into a spring that breaks either end of this upcoming week or into next week.
The second scenario is that the market simply falls apart in a series of cascading declines into end of this week, or perhaps into the May 23, 2010 date. This is currently my favored and gut feel scenario that will play out. One of the reasons I am favoring this scenario is because of the heavy downside Friday volume. It was not blow out volume but it was enough for me to sense that it could build into a climax volume with more price destruction.
Also the Euro is in a stance where it could spike lower and gold could spike higher to 1300 to 1400 an ounce in a matter of days. If you look carefully at the Euro, Gold and the stock market, it paints a picture of some type of climax type move this week or next.
If correct and we do cascade down this week then I don’t think it will be of the 1987 style where it just drops like a rock. My sense is that it will be somewhat similar to the 2008 decline where it is just a somewhat slow motion cascade decline with plenty of intraday rallies where the market fights to stay higher. But, ultimately is unable to get enough dip buying power over the course of the week.
Part of the reason for my lack of conviction in a super high speed crash at this point is simply because I think a lot of capital is sloshing into the USA from Europe which will temper our decline. Europe will undergo a total meltdown but in the meantime capital will flee that region and get pumped into USA for a while. That should help to temper our decline somewhat. The perception may be that things in the USA are ‘less worse’ than that of Europe right now.
Perhaps after the dust settles in the next week or two and then after a month or two of price basing, we will eventually get to a point where the USA gets its own new debt crisis. Then at that point the real crash can probably start. But I still think it is too early for the ‘real crash’. The July August time frame appears to be the most ripe time frame for that on a astro trading basis as well.
But now onto the headline topic of this post.
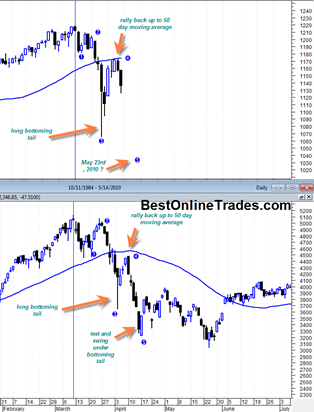
Someone from clearstation pointed out a price pattern similarity between the Nasdaq 2000 bubble top and the current sp500. This price pattern similarity is useful and quite stunning actually. On the other hand it may not be a fair comparison since the Nasdaq bubble top was the ultimate extreme price extension. Our current top in April 2010 was euphoric but not as wild and crazy as the 2000 bubble. Also the top in April 2010 was the peak of a correction from a massive bear market that begin in 2007.
Still, it is interesting to look at the similar price structures.

I have been able to calculate in my charting program that a value of 1060 in the sp500 would correlate to a double bottom in the Relative Strength Index.
The problem comes in figuring out how many actual days of decline it takes to move the RSI to that level. For my example I used 3 cascading days down.
Either way, it is a rough approximation and in the final analysis it tells me that somewhere near the May 6, 2010 swing low or slightly under it is an ideal spot to cover all short positions.
The 1060 level on the sp500 creates a closing value of RSI near the 30 level. But it is still possible to see a lower value based on a sharp intra day swing lower in the market.
So the bottom line to me assuming this cascade down scenario is correct, is that ‘somewhere within the range of the May 6, 2010 spike low will start to be an ideal opportunity to go flat or switch to the long side.