
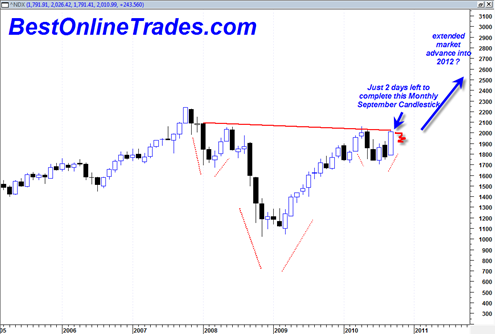
The NDX 100 appears to be coming close to completion of the large head and shoulders bottom formation identified in previous months here at BestOnlineTrades.com.
The current September monthly candlestick on the NDX 100 looks very strong. In fact it is the strongest monthly candlestick going back several years.
It is still unclear to me whether or not this 2.5 year head and shoulders bottoming formation is as valid as typical large head and shoulder bottoming formations that preceded extended bear market declines. Perhaps that is a debatable point. This large head and shoulders bottoming formation was formed after an advance between the years 2003 to 2007.
Be that as it may, the current structure of the pattern is poised in bullish fashion.

There are only 2 days left to complete the formation of the September monthly price candlestick and this Friday will start to create the October monthly candlestick. Given that the current price level is right at the neckline resistance and it is usually very rare to see the next consecutive monthly candle retrace 0% into the previous months candle, I am forecasting that when the clock strikes ‘October’ (this Friday), we will start to see the monthly October price candlestick start to retrace into the very strong September candlestick.
This retracement into the September monthly price candlestick will be the ‘October correction I was referring to in a previous post here.
I expect that early October monthly price retracement to eventually turn into an October monthly bottoming tail. Then perhaps in mid to late October to November a breakout north above the neckline.
The astonishing thing about this large pattern is that it implies a possible 900 NDX 100 points north which is quite astonishing. 2900 on the NDX is no small deal. But the beautiful symmetry of this large pattern is undeniable at this point.
I should say thought that not all head and shoulder patterns succeed. Some of them fail or morph into other complex trading patterns. Only a strong breakout north above the neckline in the NDX 100 will start to kick in the bullish aspects. I do expect that to happen, but this is such a long time frame pattern that it will likely appear to be happening in slow motion, similar to the current mega breakout in the gold price.