
Today the sp500 finished creating its January Monthly price candlestick. The January candlestick finished with an up close and without having created any bottoming tail. A medium to smallish size topping tail was created on the January candlestick by the end of the month. The market was able to evade the creating of a bearish shooting monthly star candlestick similar to what occurred on the November 2010 monthly candlestick.
So my interpretation of the January monthly candlestick is simply that it is not flashing any strong bearish reversal signal. Instead it is simply showing a continuation of the previous uptrend, albeit at a somewhat more modest pace.
The new weekly candlestick that is starting formation today has the potential to extinguish last weeks potentially bearish weekly shooting star candlestick. It would do this if we are able to get back up into and above 1300 by the end of this week. Bearishness would also be minimized if we are able to hold a close above 1275 this week on the sp500.

On the daily price action I am looking for a continued up move towards the 1296 to 1298 range and will be looking for a strong reversal to occur somewhere near that range. If we do not get a strong reversal from that range then it will begin to create doubt about the market’s ability to build more than a 2% overall correction.
Sometimes very strong trending markets correct much more sideways then they do in a steep down slope type price action. This risk always exists for those looking to go short, but we need more price data into the end of this week for better clarity on whether this will once again be the case.
The current market has a record of using sharp declines as energy for new power uptrends. It will be interesting to see if the sp500 can once again achieve this feat given the weak price bar of last Friday.

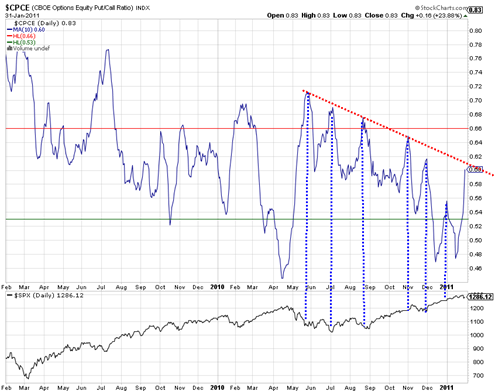
The 10 day moving average chart of the Put/Call Ratio is maybe a little bit concerning for the short side in that we see it bumping against resistance channel (red dotted line). At almost all previous peaks along this channel we have seen the market get exhausted to the downside. It is concerning that we are only 2% down from the highs and then seen the speed with which CPCE has catapulted already back up to the red dotted down channel level.
Today and tomorrow seasonally strong. Fundamentals pivot on the Egyptian crisis. My gut feeling is that the crowds will press the military into a bloody reaction in the next few days.The fact that most protesters are men tells me there is a strong Muslim fundamentalist influence behind this.
Looking for a breakout of the red trend line on the $CPCE.
Bradley turn date Feb 3
I think tomorrow is a key day for the market. If the uptrend continues, we are good to go. If not, a lot more downside awaits, maybe moving all the way down to 50MA. From a risk /reward standpoint, I think more risk than reward here.
Good points steve. Agreed that risk reward is not so favorable as far as going long the market indices. On the other hand there is always the option to put a protective stop right under 1300 and then see how far it can ride up.
We still seem to be feeding off of that cup and handle breakout pattern which could mean another 50 to 100 S&P points to the upside. Not all cup and handle patterns meet their expected targets, I think only about 50% do, but some do much more than others, so we will just have to wait and see.