
On July 7, 2010 BestOnlineTrades did a complete 180 degree turn on the market outlook from very bearish to very bullish. Since that time the market has advanced strongly although still on somewhat meager volume.
I left the door open one last time on 7/16/2010 for another bear leg but it failed to confirm the potential bearish MACD histogram signal and reversed and has now confirmed a bullish MACD histogram signal.
In addition to that the market has slowly trended higher in ‘climbing a wall of fear’ fashion. At this point I am looking for a test of the 1131.23 swing high. I expect the market to push into that number and perhaps create some sort of indecision doji or several day reversal.
After that I expect the 1170 range to be tested and then the market may go into either a more sustained reversal or simply a slow and sloppy sideways consolidation before an eventual massive topside breakout to new 52 week highs.
July is looking like it is going to close on a very strong note and the monthly July candlestick should end up looking very strong. It has already retraced a substantial portion of the June 2010 candlestick and is implying the market has strong reversal strength here. The end of this week will create the final July closing monthly candlestick. The monthly MACD histogram chart is starting to show the market may get into a stance of a MACD histogram monthly buy signal in the months ahead. We are no where near such a signal yet, but if July closes strong, and August is modestly strong to flat then we may get bullish confirmation of this signal in either September or October 2010.
I continue to believe that the right way to approach the market for now is to look for buy opportunities in individual stocks and ETFS on the premise that any weakness will eventually lead to higher prices.
There is still this wild card date of August 10th to 12th 2010 which may be the cause of a sharp reversal point. But I have no idea how that will unfold at this point and whether or not it will lead to a substantial trend change or not. For now those dates are in the back of my mind as the bullish trend unfolds.
Waiting for a collapse, depression, skyrocketing unemployment, or a European meltdown at this point to me is just a smoke screen designed to get you on the wrong side of the trend.
Very bullish forecasts right now are almost nowhere to be seen. If we look at the Dow Jones Industrials and see it above 11,500 in the months ahead on a closing weekly and then monthly basis, it could imply the DJIA will make a charge way back up to the old high points near 14,300. The 11,500 range on the DJIA is an extremely important resistance level and if broken topside, look out above.

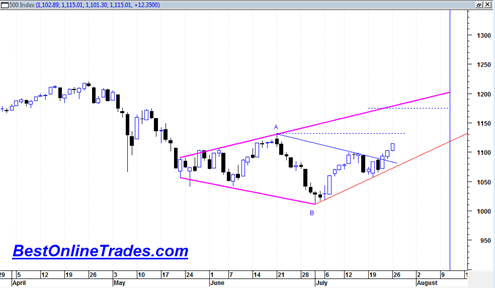
The chart of the sp500 shows what I have been talking about last week. That we broke topside out of this diamond pattern and as a first stop will likely hit the target A swing high (first horizontal dotted blue line). If you look at the chart above the two pink lines still show this inverted triangle pattern that leaves the market room for further upside after the 1130 swing test.
With the recent higher low in place we now have an uptrend defined by the red solid line. This line may become important after August gets started and start to see some downward consolidation that is more sustained.
Hey Tom,
Somehow I get the feeling this uber-light volume rally is of pump&dump nature and it’ll be done once earnings season is basically over, like was the case in April.
Which would be around August 10th to 12th, by the way, fitting in quite nicely with the astro stuff.
What do you think?
Well the light volume seems to be a given in this market. Problem is as long as they can keep closing the market higher it can continue higher no matter how much we do not like the light volume. But low volume August is ‘typically’ volatile anyway and it seems doubtful stocks can get a huge upside move going in August. Agree with you makes more sense for turning point in August and then down in August, but they key question is how deep the correction would be. If it does not show conviction then it warns we will reverse topside again. This astro date may just a short term swing point that turns the market down temporarily… Will just have to see what the setup is at that time.
Hi Tom
Sometimes I think you and I are singing from the same hymnsheet. I too have turned from ultra bearish to moderately bullish,,,, a decent close over 1130 may see me turn ultra bullish, though with the proviso that this will be temporary, and I think at somepli t next year we may see more downside.
PS I have referenced your blog in my most recent post, I hope this ok with you…
I think down wave 3 with a target of 880 should start from Thursday 29th July. Presnt rally may not touch 1146 as I said earlier. I think this rally willl reverse from 1138 intraday either on wednesday/Thursday (that is tomorrow or day after).
shrihas
Can you share briefly why you come to the conclusion that you do?
I am on the bear side also, but I have to admit, I am sorely disappointed that the investor sentiment indicators, e.g. AAll Index and Investor Intelligence, and about 3 others are anywhere close to overly optimistic. But if the turn comes late Thurs, that definitely gives chance for this wkends indicators to reflect bullishness built up over past 2 wks.
Geoff,
I have not yet shorted. I am waiting for S&P to cross 1131. I will see at that level.
Before I say something on how I reached conclusion, let us see whether I am right. I could be wrong also. Once it is confirmed will post here on what made me short market.
Shrihas
well it will be interesting to see what happens. thanks for your post
Thursday, 29 July (before mrkt opens)