
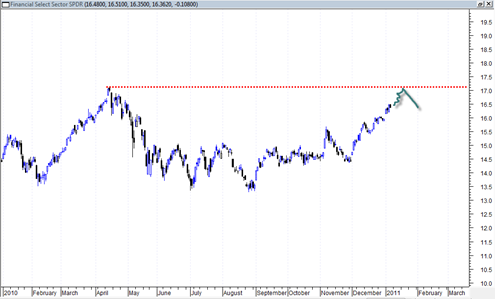
The XLF ETF has been showing a good amount of strength recently but has still so far been lagging behind the sp500 in terms of exceeding the April 2010 highs.
The XLF returning to the April 2010 highs could be a good guidepost for the next ‘more involved’ stock market correction. If and when the XLF gets back to the April 2010 highs, it could be that the sp500 will also trade closer to 1300 range which is a key resistance range.
When the sp500 reached the April 2010 highs it led to an approximate 4% correction which created a handle of a larger cup and handle formation. We continue to be in break out mode from this formation now.

It is interesting to note that the cup and handle formation on the sp500 had a cup depth of between 160 to 213 s&p points.
If we multiply either of these numbers by 50% (the percent of cup and handles that meet their measurement rule according to Bulkowski) we get a measured move objective of between 80 to 106 s&p points. 80 plus the breakout level of 1220 comes to 1300 as a conservative target for this run.
So it would seem that 1300 is a nice even number and possible ideal target and next pause point for the market. Combine the cup and handle measurement with the XLF coinciding with the April 2010 highs and we have a possibly quite potent reversal zone.