
I feel as though I am becoming a bit overconfident with some of my latest market calls. I need a gut check and a reality check. Since identifying the major market low in late August 2010 (here and here) with volume analysis which then led to one of the greatest September rallies in the history books, I feel as though I am now very ‘in sync’ with the market bull and confident in its next moves.
Being confident in your market analysis is great, but it can also be potentially very dangerous because it tends to make one more and more oblivious to unexpected future moves in the market ( in my experience). So it is probably better to keep as low a profile as possible to keep a few good calls from ‘getting to your head’.
My confidence in the least path of resistance in the market comes from my observation of the tape, the long term charts and the current psychology as well. I stopped watching CNBC a very long time ago. I tune in only on very rare occasions. In addition I also stopped reading most economic news or latest major headlines about the market from business sites such as cbs marketwatch, bloomberg or reuters. The only reason I would want to visit those sites is for possible stock ideas, but other than that it would be a waste of time. Reading just one major headline from any one of those sites can potentially affect a trader’s psychology quite heavily and probably screw up an otherwise very pure interpretation of the charts. But it is not just the business sites that one should avoid. It might not be a bad idea to also avoid most major mainstream news or political networks. Why? Because they dish out almost nothing other than bad and negative news and a lot of the time they tend to mix and associate political negativity with economic negativity. So any trader who completely avoids negative or positive business news might still get ‘infected’ with very negative or positive political news.
It seems very clear to me now that there is an obvious bull market right now. . .
A Bull Market in Bad Economic News!
Bad economic news does not drive the market. The market drives the news ahead of time. But the plethora of bad economic news has likely caused many to become obsessed with the bear side. Perhaps Jesse Livermore said it best when he talked about the most important aspect of trading…
It takes a man a long time to learn all the lessons of all his mistakes. They say there are are two sides to everything . But there is only one side to the stock market; and it is not the bull side or the bear side , but the right side.
I still believe very strongly that one of the most difficult tasks as a trader is to overcome ‘previous trend bias’. When prices move in a sideways to down range for a long time it tends to wear and tear on any normal human being and it can potentially take a huge amount of effort to switch forecasted trend bias in a completely different direction. Perhaps part of this has to do with the psychology of ownership. If you buy a red colored rock for 10 dollars and keep it for a few months you are likely going to want to offer it for 11 dollars if you decide to sell it just for the simple fact that it has been in your ownership and it is YOURS for that period of time.
So a technician that keeps a bearish bias on the market for several months and sees prices trend sideways to down in sloppy fashion AND also listens to a lot of very negative general news and negative economic news is to a certain degree OWNING that forecast and maybe getting too comfortable with it. He/she is unlikely willing to part with that trend and forecast for the same initial price so to speak. So forget about the bull side or the bear side! This is not religion.. the right side is the most important side…
I have said this before and I will say it again… That I am absolutely shocked at how so many technical analysts (and some with 40+ years experience) have presumed such dire and negative implications for the stock market when during the entire time between April 2010 top and the July 2010 bottom it has only done a 38% fibonnaci retracement of the entire advance since the 2009 march low! (admittedly I too became much too bearish during this entire corrective process). It reminds me of the time period of 1994 when prices trended sideways to down for a long time and got traders and technicians so utterly frustrated with the market when all it did was go sideways and was the precursor to an absolutely HUGE market run after 1994. A sideways market has a way of making technicians extremely bearish when they should in some cases be extremely bullish instead!
The right side of the market now looks very clearly to be the long side. Still, every time frame has different implications. The monthly time frame is pointing strongly to the long side with either an October or November 2010 closing price that is higher than the September 2010 monthly high price. The weekly time frame is also pointing towards the long side.
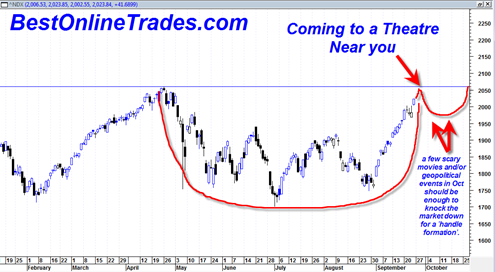
The daily time frame is indicating a top to come soon that should cause some type of shakeout in October. This top in my opinion is likely to be a temporary top with a 1 to 4 week possible duration. After which I expect the market to trade higher again.
October is the typical month where movie theatres release their hit scary movies and it can sometimes also be a month where some scary type geopolitical event causes traders and investors to sell their shares. That is exactly what I am expecting and I expect the NDX 100 Index to help guide the way…

I think the NDX 100 index is going to help identify the next correction for us. I am going to issue a short term BOT Sell signal when the NDX 100 index gets near ‘2050 and change’. That level range should initiate a sell phase in the NDX 100 and the sp500 starting quite likely either by the end of this week or Monday of next week (the first full week of October 2010).
This sell signal may be worth playing to the downside, albeit briefly. It may only be a ‘shot gun’ type of downside play with the leveraged inverse ETFS. In other words I expect the downside price action to be heavily concentrated in 1 to 3 days of market action which will likely be the majority of the decline. Perhaps we will see 1970 on the NDX as the low of the correction or in worst case 1940. Even if we correct all the way to 1940 on the NDX the market can still evolve very bullish after October.
The setup is almost TOO perfect…
3 more days of September end of quarter window dressing, then an October 1st Friday drop to kick off a first week October ‘scare’ next week (beginning on the 4th October) leading to lower prices in the first week of October.
The price decline should help to tame the bullish opinion as of late and help to bring put/call ratios back to normal range.
But again, BestOnlineTrades believes that this decline at its final depths should be bought for eventual more long side action after October…
The coming price decline in October is likely going to revive bearish dreams. But in my opinion that is the wrong way to frame the market now. The frame in my opinion should instead be anticipation of a modest to ‘semi scary’ decline as an opportunity to buy for an eventual bullish resumption beyond 2050 in the NDX 100. . .
As far as the sp500 is concerned, it will likely make a top that is lower than the April 2010 highs. The NDX100 should be the guidepost. When it tops at 2050 and change, then expect the sp500 to follow suit…
P.S. I am quoting the 2050 and change level on the NDX 100 as the starting point for the correction. But keep in mind that the correction may just as well start from 2040 and change. In fact starting from 2040 and change is a better setup because it will keep the NDX 100 still slightly under the April 2010 highs without having tested them. So perfection is not necessary here. The daily and intraday action will help to pinpoint the top.
P.P.S Keep an eye out for radio, print and TV excessively bullish headlines during the next few days. I realize i just made the point about avoiding accessing these media, but that does not mean they cannot be occasionally used as psychological guideposts and contrarian indicators (just like Glen Beck was at the final market low end of August 2010). The front pages of Business week, Barrons and the Economist may be interesting to see this weekend.
Tom,
Very good article. First half of the article is excellent. I did not like second half much.
Keep up the good work.
Thanks,
Shrihas
Hey Tom,
“But again, BestOnlineTrades believes that this decline at its final depths should be bought for eventual more long side action after October…”
Hard to argue. Any decline should be bought at its final depths. The question is how deep those are gonna be 🙂
As you know I have been long for the past couple of weeks. I am an old time trader and although I do put a lot of emphasis on the Technical s, I also am an avid tape reader.
As I mentioned last week, I never, that is never, fight the tape!
I am happy to see you also moderate your techs with the tape.
DRYS was very interesting that way today. Like WOW! As a tape reader I have to agree with you that DRYS is headed up.
My big play has been RAX as you know. Not only does it have the backing of the tape, but also it has the golden cross on its side. Plus it is ripe for a bear squeeze, plus if you look at the fundamentals, it is the world leader in cloud computing, it has to be ripe for acquisition.
Especially with the big boys like Dell, Microsoft and even HP loaded with cash and looking for an acquisition that fits.
I sold today, to take profits but will slip back in again Friday or Monday depending on its tape.
I am interested in your take as to where you see resistance in DRYS?
Good to see you Shrihas, so you mean you expect a worse correction in Oct and then lower after that too ?
Max, yes well we will have to see how deep the correction is.. certainly anything is possible given what happened with the fat finger crash, but because of all the recent strength I am thinking the correction will be ‘contained’ by the big boys and a few other political figures.
Congrats on your RAX JR. Looks picture perfect to me with an outstanding breakout. Wow. Looks to go much much higher over the longer term.. and outstanding position trade probably.
As far as DRYS. Well DRYS can sometimes be a slow moving beast. So 5.0 level is a very important resistance level. Today DRYS busted against 5.0 on record volume and it also pushed up against important previous swing highs near the 5 range. A sign to me that DRYS is going to be quite successful in breaking through 5.0
But I don’t think DRYS will be able to gap and go above 5.0 tomorrow. I dont think it is ready yet. Better scenario is that it now pulls back slightly under 5.0 to form a handle of a cup and handle pattern that began on 8/10/2010. Somewhere in the 4.5 range may be an ideal entry in DRYS, perhaps in scary October.
Your call today, for a drop in the NDX would seem to contradict a previous call for an Inverse Head & shoulders on the QQQQ monthly chart that is now at the neckline.
-ed
I was probably not clear enough in explaining the time frames. The inverse head and shoulders breakout call is more bigger picture and monthly time frame… the ‘drop in the NDX 100’ call is more near term perhaps first couple weeks of October…
so both scenarios can still play out…
a correction in the first couple weeks of October in the NDX (which I believe will occur) will not invalidate the bigger picture head and shoulders bottoming call for a bigger breakout later this year IMO.
Thanks Tom,
I was on sideline for last one month. Yes, I am looking to short. Any day from now on, if I see jump of 15 points in S&P, I will open short position.