
I am becoming concerned about the gold price trend. On July 6, 2010 I did a very bearish post on the gold price on a more longer term basis. Since then I have oscillated back and forth from bullish to bearish since gold was able to evade the weekly bearish divergence MACD sell signal.
But now we are in a situation where the weekly MACD bullish cross is not following through and is starting to appear like it wants to do a KISS failure which would likely mean more downward prices to come in the weeks ahead. This would be very unusual for this extremely strong seasonal time of year for gold. I should also point out that if this weakness continues in gold it would contrast so far quite sharply with a strongly rising paper equity market in September which is also unusual. These two observations may become more and more symbolic and important in the days and weeks ahead as BestOnlineTrades looks for more confirming signals.
I know for a fact that gold investors and traders in general are maybe one of the most stubborn group to sell out of their long gold holdings. I don’t have the actual statistic to back this up but Jim Puplava of financial sense mentioned this fact at one time in the past.
Heavy reluctance to sell long positions (against a tide of selling) is a characteristic that can show itself in the price charts in the form of a rising wedge where price makes new marginal highs instead of new highs with strong conviction.
Carl Swenlin from decisionpoint.com is the one that first observed this rising wedge formation in the gold price. I took a cue from that and then looked at the topping pattern from the Mid 70’s before gold corrected 50%.
I am not saying definitively or with strong confidence yet that we are at such a significant topping point yet. All I am saying is that this pattern is a possible warning sign combined with the weekly macd cross failure (so far). This pattern needs to be watched closely for resolution.
Obviously we are still very early in this week and so far the gold price is still holding quite strong still near the highs.

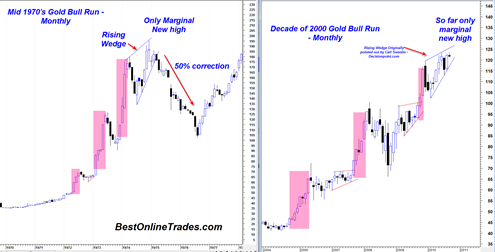
The chart above shows the 1970s advance and the right half shows the decade of 2000 advance as represented by the GLD ETF.
The red shaded areas show where the gold price advanced very strongly without hesitation from previous congestions areas.
Note that the top in mid 1970’s was shown by a large rising wedge on the monthly scale. The gold market at that time had made a top by failing with conviction to advance above and beyond the previous resistance. It hesitated.
In the current time frame we also see this rising wedge and hesitation to break out to new highs. Gold has only so far made a marginal new high, similar to what occurred in the mid 1970’s.
There is still the option for the current time frame gold price to blast to new strong highs in September and October to avoid this hesitation, but if we do not start to see some real moves with conviction during September and October it is going to build more and more (bearish) concern in this market.
It is best to take this one step at a time. I am teeter tottering right now and that is what I am trying to express in this post. The recent light volume on the August advance in the GLD ETF is also a concern.
Any time a market or stock approaches a new high, it is generally not good to see excessive hesitation near those highs or only marginal new highs because it shows risk of topping formations.
Instead what you usually want to see is price HUNCH right under the previous all time highs and then SPRINT higher like a race horse as gold has done in the red shaded portions of the chart above.
I have been hearing often that the gold market still has to enter its blow off speculative phase similar to what occurred in the 1980 time period. I fully agree with this. But the aspect that I disagree on is the potential timing.
The advance that began in 1970 and peaked in 1975 was a very nice and strong run. However, compared to the run from 1977 to 1980, it pales in comparison in terms of price persistence and trend.
My take is that the 1970 to 1975 run higher in the gold price was the ‘preview run’ that was the first massive warning shot the gold price was sending to the world. It was the big warning flare up in a star lit night sky. But the REAL advance was the blow off 1977 to 1980 run. THAT was the supreme speculative public gold bubble that mainstream public participated in.
The first run was about 5 years long before the midpoint 50% correction. The 2010 run so far is about 10 years long. Hmmm, I see a pattern here. The current 2010 run is about double the time of the first 1970 run of 5 years.
The corrective leg in the mid 1970’s (the 50% one) was about 1 year and 6 months long. So does this mean that we are now going to go into a 3.2 year downward 50% corrective leg in the gold price?
I am just thinking aloud here and speculating on longer term themes. The near term and intermediate term is the main focus for now as we see how the current patterns evolve. Again, gold can still evolve bullishly the next month and a half, but we are going to need to see this market prove itself in the coming months…
This is at this point at least a possible developing story here on the gold price.
Stay tuned for more updates and developments . . .
P.S. There is also an interesting correlation between the overall stock market 1970’s structure and its relation to where the gold price was and when the gold price peaked out. It is very interesting that the current stance of the gold price, the rising wedge pattern and also the current stance of the stock market is similar in configuration to the mid 1970’s period respectively as well. . .
For an extremely bearish take on gold in the very short term, see Rosen Market Letter posted on Kitco website on 9/13/10. It calls for the HUI to plunge from current 480 to something less than 150 by the midpt of his time range of 10/20/10! Yikes!
This market letter has been preaching this plunge for well over a year. Ostensibly, he relies on time frames and if they do not come true within time frame than the move is just up and the next move will occur. In this case Rosen is expecting a crash in gold followed by the mother of all bullish spikes.
So, if, according to his time constraints, there is no crash by around late October than, if I understand him correctly (and his writing in my opinion is getting more and more esoteric) than the mother of all gold bull moves is just around the corner – – meaning probably within 6 months or so.
Your response to another comment writer about “the stars” indicated that you had given up on that. I doubt you have until the next prognostication comes along that temptingly indicates that the astro aspects are once in ten thousand year event or even more rare.
I think you owe it to your readers to explain who you are, your credentials, and how this website is maintained and paid for. There is no doubt that someone spends a lot of time doing analysis and the website is generally extremely well functioning.
This stock market prediction business is a very tough business. So far, even the London analyst of GS who puts out extremely elaborate monthly powerpoints on where the S& P should be (940 or lower) has been wrong. If his powerpoints are to be believed they are meant only for the most sophisticated and well heeled investors (with accounts of tens of millions of US$)
If this was easy, we would all be rich. But than some are rich and we find out later they had a scam. It is simply incredible that Goldman Sachs in their first quarter did not have one losing trading day or whatever they reported. It stretches the bounds of being credible and certainly begs the question on exactly what it is that they are doing.
Personally, i doubt that gold will decline substantially. I think 1040 is the approximate floor since that is where the India Central Bank bought 200 tons of gold from the IMF. In hindsight that significant purchase looks very well timed.
Today’s action in the gold price seems to be invalidating ALL the mega bearish forecasts. Gold was at a tipping point yesterday and today it rejected the bear side very strongly. Upside volume on the GLD ETF is extremely strong. This is a very positive sign.
As livermoore said if it is not right to be short, then it must be right to be long…
I think that is astonishing that GS made a 940 sp500 forecast. Seems like they do not do volume analysis, what a horrible forecast.. but I guess it happens sometimes… market seems to find a way to trick the majority.
This website is run by me and me only. I write when I feel there is something important to say. I am not running a conspiracy here. I have a B.S. in Finance and I just enjoy trading and am self taught trading since 2004. I am glad to hear the website is well functioning because sometimes it is hard to tell if all the pages are displaying correctly and at the right speed. Do you find the site loads fast enough? does it hang? do you see any errors?
All the astro talk I did during the last several months I admit in hindsight was not such a great idea. I was blinded by Larry Pesavento. Perhaps I considered him a ‘trading God’ who can do no wrong since he has made some very precise forecasts in the past Ie. the march 2009 low. But then he kept trying to pick a top since July 2009 up to april 2010 and was never right. then he was wrong with the astro crash stuff very badly and much too bearish during the last 4 months. His confident crash talk really influenced me and really caused to me to make some very bad trades.
But I cannot blame Larry P, i have to blame myself for surrendering to his forecasts.
Apparently Jesse Livermore did the same thing. I just found this out half way into his book. He started to follow this other forecaster in the sugar market who seemed to also be a ‘trading God’ and instead of livermore sticking to his own principles got beat up very badly int he sugar market.
it certainly did NOT take a trading God to call the March 2009 bottom. was it the absolute bottom – – who knew at the time, but if the market would have gotten much lower the world was literally coming to an end, so why not bet that that was NOT going to be the case.
the site loads very quickly. the only inconvenience is trying to follow the comment string following a posting by yourself. it is difficult to remember where I left a comment and to see if there is any reply. . . not difficult for a day or two, but much beyond that it a bit inconvenient, but doubt there is much that can be done about that.