
Well it is official. I am pulling the plug on any crash scenario. It took too long and there are bullish divergences all over the place right now between price and MACD. This was not the case in 87. There was a moment in 87 scenario were the possibility existed for the market to turn around into a bullish divergence, but it did not occur and the market fell apart after that.
However presently the macd histogram and the macd itself is printing a bullish divergence between price and the indicators. This is a bullish sign and usually leads to follow through. That follow through will likely take us into earnings and there is a risk of even more follow through during that time frame.
I would rather pull the plug now rather than sit around hoping for bearish feelings to be proven. I can’t fight with the charts and the indicators.
I am also seeing a bearish divergence between price and MACD on the bonds iShares Barclays 20+ Yr Treas.Bond (ETF). So we could see a big sell off in bonds and have that money pump into equities as we get into earnings. I suspect that the earnings are going to be good and people are going to realize that they were too bearish on equities.
A high unemployment rate does not necessarily mean that company earnings are going to crater. There have been very long extended rallies with persistently high unemployment.
At this point I think it is a mistake to hold onto a bearish stance in the hopes that we somehow start to collapse immediately after today’s rally.
I realize this is a complete change in opinion. The only thing that will get me bearish again here is a rapid decline that breaks under recent lows. There is still the 1070 level that I indicated before could be a stopping point and then a reversal point. But still for now I am looking for neutral to higher in this market.
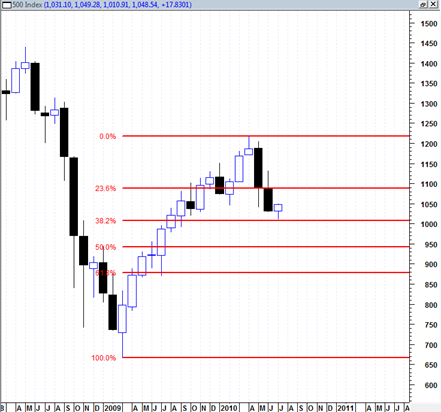
One chart that really bothers me as far as the bearish side right now is the long term chart from the March 2009 lows. You can see clearly that we just recently stopped at the .382 retracement level of the entire rally that began in March of 2009. Any market or stock that only retraces to the .382 fibonacci and hesitates or ‘never’ goes any lower than that is by definition a very strong market in a very strong bull trend.
Notable also is that the current monthly candlestick has tested the .382 and has now bounced strongly higher. We are still early in July and this candle may not expand to the upside perhaps longer than is currently believable.

I am not saying we are in a new bull market, but at this point I have be very careful about latching on to other popular bearish assumptions such as ‘deflation’ , ‘depression’ and other heavy bearish terms that seem to be turning into a religion at this point.
If this week turns out to be an up week then it could start to curl up the weekly macd histogram starting next week, so it may start to turn up the weekly trend.
So again I think it really important to keep a very open mind at this point and study the tape carefully.
The depression – deflation collapse scenario is not a guaranteed scenario as much as it might seem that way at the present time.
At this point I am not willing to turn into a bull but there are some important down trendlines on the sp500 near the 1090 level that if broken topside will potentially turn this market into a new bull.
There are also some other charts that span quite a long time frame that could indicate quite a strong bullish scenario later this year. I will be posting some of them in the days ahead.
Good post.
As I said sometime before, we have megaphone pattern and S&P will touch 1150-70 range. Just because today was strong, I am not saying this. But let me honestly say, earnings are going to be rock solid.
almost all banks will post rocksolid earnings, AAPL will break upside to 320. Around 18th July, you will ask yourself whether we were ever in Bear market.
But that will exactly be end of bull market. Markets will spend about 3-4 days around 1150 but refuse to go any higher and then breakdown will start.
Shrihas
well on 30th June you commented (see below quote) and you are looking pretty good after today’s action – – it sure will be interesting to see if we get as high as 1150 – – but congratulations for now
:
quote Hi Tom,
I think it is going to be Megaphone Pattern from now on. It is going to be Wave E starting from 1027 on S&P. I could be wrong but I think we are likely to touch 1150 on S&P in next about 14 trading days and then fall very hard.
Please keep up the good work,
Cheers,
Shrihas unquote
That would be a great call Shrihas. It has to be a massive short squeeze to get to 1150 from here. Can you post a chart of it?
Shrihas
Given the time frame you suggest, I assume you are drawing the megahone from end of May 2010. You could also draw a megaphone from around November 2009 which would indicate a much bigger pattern and not peaking until late Sept / Oct. Thanks for your reference to megaphone, I had to look this formation up on google.
What i saw on google suggests that IF / after the potential peak at the end of next week, it would be back to slightly below where we were – – maybe to 980 or so, than a sideways / up move maybe to around 1020 (maybe a month or so) and than down to 850 or so during Sept / Oct.
If the dramatic up move of today continues for the rest of this week and continues with some force next week than the AAll Index will hopefully flip from 24.7% bullish / 42% bearish (as of July 5, 2010 – Barron’s) to hopefully maybe 50% bullish to 30% bearish by July 19 Barrons. The July 5 reading was almost a buy signal but not quite, e.g. in March 9, 2009 it was about 23% bullish to 70% bearish – – a very very extreme reading, perhaps the most extreme in history.
I think fundamentally the markets are headed for a lot of grief – – the earnings may be solid this quarter (i agree) but that is ancient history – – investors will be focusing on guidance going forward and the much more difficult comparisons that will have to made in the 3rd and 4th quarters. I think the guidance will be mediocre at best.
Thanks to Tom for incredible time he MUST put into his posts, and thanks for your comments.
Geoff,
This is Tom’s website which he developed taking lot of pains and we have ended up discussing. “Textbook” or “Google” pattern if holds, everyone would make money.
Also, note that Tom was not wrong on most of the ocassions, he was early. Please put a time delay on his posts and act.
Tom
I think if we hold today’s highs or close by, then I still favour the next and probably most dramatic leg down to start within next week or so. I have also been looking at the 1987 comparison, plus the 2007/08 weekly comparison. The exaxtness of the comparisons may be gone but I still think we are rhyming quite well. BTW both comparisons also had potential megapones and both had Bullish Divergence at a similar point to where we are now.
I’ve updated my posts which shows the potential divergences and bullish patterns (though have not used Megaphnes). this can be seen at http://hometraderuk.blogspot.com/
I do think that we need to hold below 1075 on the futures though, otherwise Shrihas’s megaphone patterns could come into play.
Regards G70
Further to previoues comment Tom. on the US 10 year yield, we have (just) by the skin our teeth held a crucial resistance at 3.05% This was my line in the sand the way down. this was a chart I posted of this a few of weeks back showing this key line before it was broken. http://3.bp.blogspot.com/_bz2Veynkoic/TB96N2VuQwI/AAAAAAAAAIE/UFidSrB3d_E/s1600/USD+10+yr21+June+10.jpg
FWIW I posted a comparison comparing the price action of the 10 year with a previous pattern. It can be seen here: http://hometraderuk.blogspot.com/2010/06/us-10-year-overview.html . I have just checked beck at daily momentum on the earlier pattern and it is behaving in a similar pattern to current price/momentum behaviour.. I am not saying a yield bounce is not on the cards, just that this momentum behaviour would not be inconsitent with a large, steady but not too dramatic yield drop in a similar fashion to the 10 year yield in Q3 2002. – I guess the upshot of this and the S&Ps is that they are all markets are on pivotal levels,, S&P futures I guess around 1075,, though may be a touch higher,,,, 10 year 3.05% … AUDJPY 78.00 etc. etc. Risk on v Risk off.
Further to this.. Thank you for all your excellant posts and analysis.. I hope in some small way I can help add your work in some way…..
regards
G70
Hey Gooner Shrihas and Geoff. Let me know what you think of my latest post. It does a complete 180 degrees of the theme I was on previously. Let me know if you think I have completely gone crazy 🙂
I would rather figure out now (or sooner than later) whether we can evolve into a bullish phase again rather than much later.
If I am correct on a new bullish phase developing then it probably goes without saying that it could be absolutely devastating to the pocket books of the die hard bears.
There will be important guidposts in the days and weeks ahead that either help to confirm or invalidate the various scenarios…. should be interesting.
See:
http://www.bestonlinetrades.com/20100708/deflation-inflation-confusion/
-t
Nice charts Gooner thanks for sharing. Yes indeed pivotal levels. I suppose I am just going to keep things simple. As long as we do not go under 1010.91 I will maintain a bullish bias. And if we are not even able to break under 1040 again then I will be even more so leaning in that direction..