
The price action in the market since the 4/21/2011 swing low has been quite laborious. Yes we have been in an uptrend, this is true, however the nature of the uptrend concerns me relative to the 2/18/2011 swing high.
This market is currently struggling to exceed the 2/18/2011 previous 52 week high, in fact it looks like it is embarking on a process to roll over (down). The observation which earlier today led me to initiate the BOT Short Signal was simply a quick look at daily, weekly and monthly MACD along with monthly MACD histogram. In addition I made an observation of the tape action itself from the mid March 2011 swing low and observed the angle of incline combined with the time it took to do the incline. This is definitely more art than science, but I have look at so many thousands of market charts over the years that one begins to get a good sense when the market is rolling over just by the pattern it is forming and not even looking at any indicators.
The fact remains right now that the daily MACD and the weekly MACD are in sell mode. The monthly MACD is in buy mode, BUT there does exist a large potential bearish divergence on the monthly MACD histogram that has the potential to crack this market down LONG TERM.
One could also make the argument that the monthly price chart of the last few months resembles a little bit the monthly price chart topping action of mid to late 2007.
In addition I did a post previously titled The Most Bearish Monthly Hanging Man Candlestick in 41 Years on the sp500. At the time I wrote that post I think it was a superb observation. But the problem with the market and superb observations, is that many times there exists a long DELAY before that observation actually has any effect.
So we did see the market advance for two more months after this bearish monthly hanging man, but the advance has been far from powerful. So we may start to see a confirmed effect from that monthly hanging man quite soon (meaning hard down prices).
A close below the monthly hanging man low would confirm it.
If the market does form a major top here, then it would seem to confirm a long held theory of mine that we are mimicking the mid 1970s time frame

The market also now has to soon contend with the Marty Armstrong 8.6 Year Cycle Turning Point which is only roughly 20 trading days away from today.
It will be interesting to see if the market tops out on this date or falls down into it. I suppose at this point both options are possible.
It is probably foolish for me to expect the market to do something exactly on or near the June 13th, 2011 turn date and it could very well be that the peak of 9 days ago was already the top.
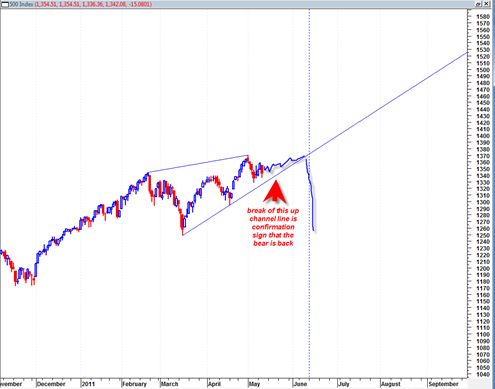
I would watch for a break of the near term up trend line as confirmation that things are about to get more bearish than we are used to seeing.

There also appears to be structure similar to a rising wedge in the sp500 although this is not so uncommon.
So in summary I don’t think we are quite ‘there’ yet. But I think we may be getting close to bearish trend change type action on the longer term time frames. The sp500 price action over the next 20 to 30 trading days will be CRITICAL in my opinion.
Thanks for the insight.
Tom,
are you familiar with the M-A pattern that is playing out on the monthly? Could set the stage for the spy to go all the way down to mid 40 level.
Some Experts with Great Track Record are calling 1440ish soon before major downside.
Any new update for Silver ?
Silver got down o $32 today premarket
No i am not.. which moving average pattern are you referring to ? Seems like quite a forecast from moving averages.. wow.
well i could be wrong about saying the floor is 33 to 34 in the SLV etf, but I am sticking to that prediction. Today even though we broke slightly below that range on the SLV it was done with only 184 million shares compared to 300 million as the panic low. So we should bounce higher from here… But I could be wrong… if I am wrong then we will continue to break down from here with price not showing much upside ability.