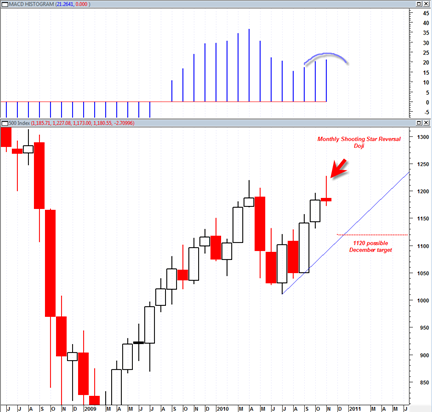
The market is having a hard time letting go of its bearish tendencies. Once again I have to say that I am pleased that the BOT short signal is still intact. The market does not appear ready to break north of 1201 on the sp500 any time soon. It did appear like it would after yesterday’s reversal day. But today there was zero confirmation of that reversal candle.
The sp500 finishes November 2010 with a quite bearish looking MONTHLY shooting star reversal candle. On the nasdaq composite it is only a monthly indecision doji but on the NYSE composite the shooting star reversal looks even more bearish.
A shooting star reversal does not have to mean imminent price decline the next month, but it at least has the strong potential for such an event. If this November 2010 shooting star reversal hammer is to play out perfectly then we should see immediate weakness during the first two weeks of December, and possibly dramatic weakness.
Note also that the MACD monthly histogram is now starting to curl over downwards which implies that the current monthly advance is slowing. We do not have a bearish triple M on the monthly histogram but we surely would if we get a down December month.
The McClellan summation index gains downward momentum today and the percent of stocks above the 50 day moving average also moved into a weaker stance today.
The QQQQ broke down today on very heavy volume and also broken down south out of a rising bearish flag formation.
The evidence seems to be mounting for the bearish side of the market.
Very notable today was the strong upward move in gold despite the stock markets bearish tendencies. Is it possible we are about to see a complete inverse correlated precious metals sector versus the paper equity market? The setup seems to exist at this point but it would become much more obvious with a hard down December in sp500 and a hard up in the gold market. Maybe the gold market is starting to move on war fears now in some form of blow off upside run?
AAPL seems to be continuing to form a head and shoulders topping pattern, but the SMH and the Dow Transports look the strongest at the moment.
Seasonally one would think that December should be up. But we just saw that Thanksgiving week instead of being up was simply absorbed. This may suggest that we are topping on positive seasonals now because we have come too far too fast and need more downside correcting.
If we start to show more ‘easy’ weakness rest of this week then I think 1130 is a possible target at some point in December.


Wow, shooting star on MONTHLY. Thanks for pointing that out. Getting my bear hat on…
As I have mentioned previously my charts are all showing an indecision pattern. The Wilshire 5000 is forming a nice indecision triangle.
Why the indecision, this is indicative of the wealthy 1-5% who own over 50% of the wealth of the country being undecided about the Bush tax cuts which are about to expire.
When we say 50% of the wealth, where do you think most of this wealth is located. Why obviously it is in stocks. With some also in bonds. This is the classical DUHH!
Now most of this oligarchy have very substantial profits in the market. If the Bush tax cuts simply expire, they will have to pay more on their stock profits.
So for the sake of prudence some of these profits will be liquidated to avoid a much higher tax. They can always buy them back next year.
So this prudent investment decision based on tax planning is showing up in the market!
However as it becomes more apparent that the Bush tax cuts are going to remain at least for a couple of more years, this selling pressure will wane and the corollary is that the super wealthy will stop selling and will start buying again.
Anyway this, “I have to go, no I have to stay” attitude in the words of the great Jimmy Durante accounts for the indecision we have been seeing.
Remember follow the money!
Nice obseration JR. I have not been following the tax cut discussion that much but what you say seems to make sense. But given today’s huge rally maybe that end of year selling ended today ? Seems like a huge sign of strength today that may mark the end of the recent correction and now we go into the new year ‘head first’….