
It is starting to look like the recent correction we have seen in the sp500 is coming to an end. The stage appears to be set for some type of Christmas 2010 rally that takes the sp500 to possible new 52 week highs. The reversal today was quite significant and occurred at the bottom of a somewhat small rectangle formation that was similar to the one that occurred in the very early September 2010 time frame.
Sometimes rectangle formations can serve as reversal structures instead of continuation patterns. This may be the case again this time around.
A number of ETFs including the Dow Jones Industrial Average DIA ETF showed a bullish volume reversal spring today were it tested the 11/16/2010 swing low on 36% less volume and then closed back inside the range. This is a bullish reversal signal and shows that the selling potentially ended today. It implies a move back up to the 1200 range again and a possible break through. I will switch to BOT long signal on a break through of 1200 on sp500.

The chart above shows the rectangle formations and how they can serve as potential reversal patterns as well. Note also the daily MACD finding support in the recent range. Above 1200 and I think we have a Christmas rally on our hands.

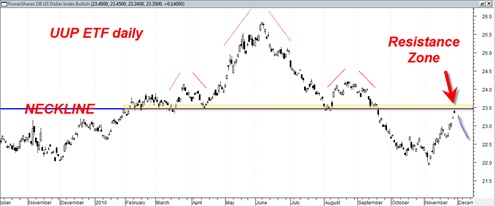
The UUP ETF is just about to ‘bump its head’ on an important resistance area and this would seem to support the case of a Christmas rally and possibly a Gold Price Christmas rally as well.
The UUP could pull back from the current resistance range but it does not have to imply that it will start a new down trend as well. For now it may just be a normal retracement at previous neckline resistance of the previous head and shoulders topping pattern.
The Dow Transports chart looks particularly strong and the SMH semiconductor index does as well.
There is only 1 trading day left in November 2010 and the market may be able to evade the potential bearish monthly shooting star reversal candle I mentioned several other times. We are in a key time frame now as we switch over from the November monthly bar to the December monthly bar.
Sorry, I do not see bullish case. At best, I see case to muddle thru as money managers try to maintain gains to date. I think foremost in my mind is that investor sentiment is simply too bullish at this juncture to support a rally of any magnitude, and insider selling has been stupendous, if not breathtaking.
Fundamental problems such as (1) lame duck Congress needing to confront significant and multiple tax issues and extending unemployment benefits (2) Europe, (3) Korea, (4) Iran / Israel and (5) belt tightening / Tea Party / vastly overextended public spending on Federal and State levels. I think we will muddle thru til year end and possible mid Jan but simply muddling thru will, i think, really “goose” investor sentiment from elevated levels to super elevated levels. In my opinion if even only one of these fundamental issues blows up, seriously blows up, the market is toast for a very quick 10% or greater correction.
I do note, however, that in the past year as fundamental problems have been “overcome” by simply kicking the can further down the road (e.g., QE2) the market has celebrated and assumed that there is more ‘time to play”
I fear I am too pessimistic, but I agree with one market pundit who observed in Barron’s in the last 12 months that market is walking on a dilapidated slat bridge over a ravine and the pedestrian is not really too conscious of where or what he is walking on as he tries to traverse the bridge to get to the other side.
It is dangerous to arbitrarily draw MACD and make a strong conclusion like this!! I am looking at MACD 12,26,9 and it is indeed heading South. Unless there is a strong rationale for choosing the MACD variables as so, I would ONLY rely on price + volume + time action.
All I see now is a “trading box” between 1170 and 1200. Bulls and bears are fighting it out, we shall see who wins. I would go with a decisive break out of this box.
One more thing. While today’s candle looks like a strong rally, I look at it as a “hanging man” candle. Strong on the surface, but scary to the bulls, causing them to start taking cover.
Tom,
Thanks for the update. To turn, I will not wait till 1200 ON S&P. As soon as S&P touches 1161, I will be in stoploss at 1126.
IMO, it will not be new high before Christmas but it will be after Christmas. I think top in January will be major and will not be seen again for atleast a year, IMO off course…
Could be wrong taking such LT approach….
It should read
“Thanks for the update. To turn bullish, I will not wait till 1200 ON S&P. As soon as S&P touches 1161, I will buy with stoploss at 1126.
based on the trading action on last day of November, the potential is there for a very bearish monthly reversal.. will have to see how it closes by end of month for real potentials…