
I am glad that I kept the BOT Short Signal live as of my previous posting. This appears to be the correct decision now. The SPY ETF and the sp500 appear to be staging a very weak day after Thanksgiving attempt to move higher. It is not working. I don’t know if this market was fed some ‘dry turkey’ yesterday, but for now it looks like it was and is in a bad mood now.
This very well could be an A B C down move and is further supported by the continued rally in the US Dollar today. I just do not see how this market is going to be able to completely ignore the rallying US Dollar index.
Still, the SPY for now is holding ground in the middle of the range and still has some recent ‘higher lows’ to work with.
I don’t know if anything significant is going to come of the US and South Korean military exercises that will occur this Sunday, but I would say that the timing for them to do such exercises is HORRIBLE. Murphy’s Law says that what can go wrong will go wrong. Will North Korea finally do something for real and take a shot at some US war ships this Sunday and send the futures limit down Sunday night? I don’t know, but the tape is showing at least some possibility of setting up that way right now.
On the other hand the downside volume is showing extremely light today which of course is no surprise.
So I will still stick with my earlier tack on the sp500 that 1201 or higher will switch me back to a BOT long signal, but as long as we trade below then I will keep the BOT short signal active.

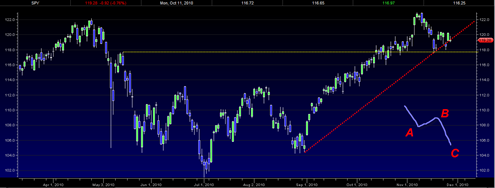
The chart of the SPY ETF above shows that we are sitting right on up trendline support and perhaps getting a bit too comfortable near this range. The long horizontal yellow line shows 117.54 as a very key support area that must hold to maintain the bullish posture going into next week.
I have drawn in the ABC type move that I am expecting to occur sometime next week.
Also important to keep in mind as I alluded to in previous posts is the shaping up of the monthly November candlestick. That will potentially become very important as we finish up the first two trading days of next week that will close out the month of November.
If we look at stocks like AAPL, AMZN, NFLX and the SMH semiconductor index, it would seem to contradict any bearish sentiment I am expressing in this post. So remember there is still always the bull and the bear side. The SPY finds itself in a sideways rectangle trading range that can either break above the range or below it. At this point I am speculating that it will break through below it, but we must let the market show us the way next week for more confident trend signal.
i do not understand the “why” lines are drawn where they are drawn, e.g. your red dashed line – – – seems to me you could have drawn that line about 7 days earlier with a steeper trajectory. if that had been done, we would have broken the line. in which case why doesn’t this look like set up of 1987 or April 10?
while i hope for something more dramatic (bearish), i think probabilities much stronger that we muddle at these levels to form a “handle” and than some time in Jan decide whether or not it “is” a cup and handle or the whole thing breaks down.
Aall Investor Sentiment Index closed wk 11-24 rebounded very smartly. 10 day sma of AD is now on a negative string but only about 6 days or so. . . if next wk is modestly up week than string will turn back to positive. 10 days sma of Trin / Arm is about 1.25 which is bearish territory, but certainly not to anywhere near extreme level
Yes well first off I drew the up trendline rather hastily. Second there are multiple potential trendlines that could be drawn at different angles. Good point.
I think I was trying to draw an up trendline that was somewhat parallel to the angle of the highs of the rally from early September to present…
So you do not see a big drop until after January? Seems reasonable to think so. But the dollar keeps blasting higher by 1% per day. Seems like it could serve some ‘hits’ to the market if that keeps up at the current pace.
well, i am traveling to Europe for a couple weeks starting this coming Tues nite, so i hope that US$ stays the same or gets stronger – – – but my “hope” may be kiss of death
also, i remember 2 yrs ago that US$ was on a considerable strengthening run and gold was in sync with $ – – so at least relationship with PM is not always contrary – – period i refer to was Feb 08
The charts seem to be really difficult to read right now. That is typical of an indecision pattern.
Wilshire 5000 RSI neither over bought nor over sold.
Yet all the indexes seem to show the market hugging the 50 MA, which would indicate a probable modest uptrend for the next few market days.
I think that Tom’s observation about the S. Korea and U.S. joint exercise is right on, as to why a lot of traders decided to go flat on Friday. Why take a chance of some military confrontation.
I think it is a mistake to read anything bigger than that in the low volume Friday action.
Look to next week for the market to tell us what direction it intends at least until the end of the year.
“Although the future I cannot see, I guess and fear”
Timorous Mouse
I have modest long positions in LVS and RAX.
Today 11/29, we closed with a bullish engulfing candle on the daily SPY chart. If we break through the trend line running down from 11/9 to 11/24 on a gap up tomorrow then it is off to the Xmas rally
Bearish case is still a double top on weekly charts rising to the 61% Fib retracement from the late 2008 highs and a Bearish Harami candle at the top of second top
Nice forecast Ed, I was thinking the same thing regarding Xmas rally. I see bullish volume springs on a few index ETFs and I also see the UUP at key resistance. Seems like a setup for the rally you refer to. Nice call.