
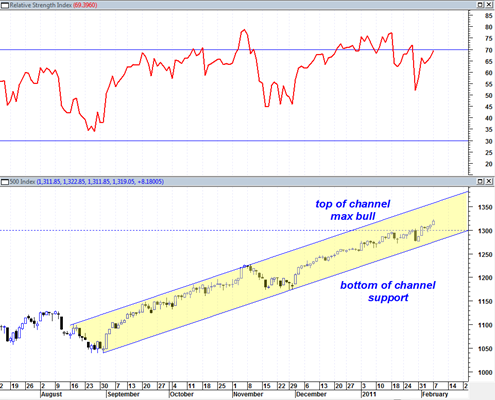
The sp500 today continues to be in up trend mode after having broken through 1300. The sp500 is also still trading within a 5 month trading channel and continues to trade near the middle of the range of the channel instead of at the peak upper boundary or bottom lower boundary.
The current trading channel reminds me a little bit of the 1995 channel in the market that was quite a narrow range, tight trending market with only a few occasional corrections along the way until we hit 1996.
The McClellan summation index once again switched back into bull mode today as the 5 day exponential moving average crossed over the 10 day exponential moving average. The summation index, similar to the MACD offers much better signals during strong swing trading ranges. During strong up trending markets as we have now the summation index to a certain degree is just ‘dragged along’ for the ride as the market pushes higher.

As of today I see no reason why this rally should collapse. I have several working theories about when it may end (for example the Marty Armstrong mid June 2011 8.6 year cycle date) but that is several months from now. For now this just seems to be a market on auto pilot and one much too hazardous to consider shorting.
It is possible we could be already in the parabolic portion of the current rally as we see RSI sitting right under the 70 percentile zone and possibly ready to break into and above this zone. That could lead to a string of vertical moves. But the more likely scenario is simply more of the same.
The next major resistance zone I see for the sp500 is the 1370 to 1400 zone.
It is going to be interesting to see whether or not the Nasdaq Composite will head to the 2850 range and then at first jump right over this range initially, but then eventually succumb to the supply forces at that peak 2007 level.