
The way the market is trading right now suggest to me that it is going to make a decision off of the GDP number this Friday. Odds seem to suggest that the number will either be in line or good which would seem to support a break out type move.
In recent days I have been focusing on the IWM Russell 2000 ETF as a possible leading indicator. The Silver ETF has been perhaps the ultimate leading indicator (new 52 week highs today) with the Gold ETF being the second best leading indicator (Right at previous 52 week highs, but not new 52 week highs yet). Then I would say the IWM falls in third place.
I do not want to ‘pre judge’ the IWM ETF too much at this point. My bias now is that it is headed for an upside breakout from the current congestion range, but depending on how the end of week shapes up, it could still be at risk of a move back down into the neutral zone.
Making any commitment now would be a mistake because the market has not made any clear decision yet. It still has to work out a few small battles in the near term.

A break down through the short term up trend line is the first indication that something is wrong with the potential northward breakout.
By the way, the sp500 is currently in the process of either completely evading the quarterly bearish shooting star candlestick or submitting to it. There are only 6 trading days left in the quarter, and I view them as very important trading days as the market has either the opportunity to strongly evade a massive quarterly shooting star candlestick, or start to conform to its more bearish implications.
So it appears the best current course is to be in wait and see mode. One could say that the SLV as a leading indicator will point to the IWM doing the same in the next few days. But first we would likely see the GLD make a new 52 week high and then the IWM would fall last in line, but before the sp500.
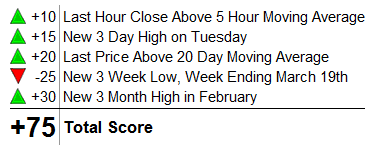
MarketClub’s Chart Analysis Tool gives IWM a Positive Rating but not Max Positive:
iShares RUSSELL 2000 INDEX (PACF:IWM)
![]() Uptrend
Uptrend

Full Chart Analysis and Up to Date Daily, Weekly and Monthly Trade Triangle Signals on IWM
I know that you tend to discount EW, but I should mention that the EW tecnicals are tracing a perfect minor-sized count on the daily $SPX chart. In other words, the count is indicating a 5 waves down pattern with the typical a-b-c three, up wave corrections. In order to get the EW text book down minor size count you need an expanding shape which I pointed out in a previous post. So the expanding up side action the last few days has been EW perfect for a sharp continuation of the down move. Accordingly, EW is looking for SPX around 1308-19 to complete the c wave up, then a strong down by the end of the month. There is a possibility that the necessary breakout in the a-b-c pattern which took place today might(not too likely) be the c wave high since it stopped at the same b wave high of 1300 on March 17, which is a tad suspicious. This would require a lack of steam on the bull side. BUT still it is possible, note that the WLSH, NYA, SPX, VLE etc, etc are ALL bumping up against their 50MA! And non broke out! Could be the bulls are finally out of steam. So we could be at the c-wave top. We are due, but it seems a little too convenient and a tad early for a c-wave top. But not impossible!
Here is how EW looks: expanding channel traced from the Feb high 1297, March 2 high 1332, so this is the expanding up line channel, where EW has a black box containment 1308-16 and then a channel low traced from 1299 low on Feb 24 to March 17 low 1249. Following that channel you can see the correction could be pretty massive., somewhere in the 100 point down correction at least.
No panic bear here! But we will all know in the fullness of time.
JR- – i am reading you and am ready for 100 pt down correction if it materializes.
JR – – you refer to EW but there are obviously many ways to interpret EW. i have referred to the following EW website various times. this Purdue alum has been very very very accurate and he is very bullish. if you have not done so, you may want to check out his public posting for both long term and immediate term – – his last public posting was coincidentally last nite
http://pugsma.wordpress.com/
Nice EW analysis JR, thank you. You could be right especially if we look at how the 2007 market topped.. first there was that initial big drop and then a retracement back up to the high and slightly exceeding it before finally rolling over…
Always a risk that upon returning near or at the previous high there can be another big down move.. Problem is not sure I can make valid comparison between 2007 and now since the longer term time frames are set up much differently this time around..