The sp500 is looking quite bullish as we go into the end of month and end of quarter window dressing time frame. It is looking like ‘they’ will squeeze this market right up into the end of quarter. Depending on how high they squeeze it, we could see some dramatic improvement on the longer term charts.
The fact is that the QUARTERLY price charts are still showing right now that we are in a major bull market. However, we are at a juncture right now as we change into next quarter where the quarterly price charts could either tip more towards bullish or bearish. Clearly a lot depends on how we end the year.
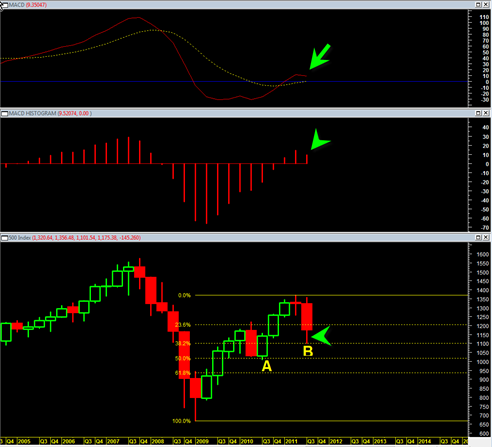
The quarterly MACD turned bearish and negative in 2007 right before we saw the devastating 2007 to 2009 bear market.
Now we are at a juncture where the same could occur, but the market is currently deciding whether or not it wants to initiate a major new bear or a continuation bull.
Strange as it may sound, the next 3 trading days could play a big factor in this decision.
The chart above shows the sp500 quarterly price chart. One can see the quarterly MACD that crossed bearish in 2007 and led to a devastating extended bear market. Currently the quarterly MACD is still in bullish crossover mode and a quarterly bottoming tail is being created on the current quarterly price bar.
Note that the low at ‘B’ is almost a perfect 38.2 % fibonacci retracement of the entire rally from the March 2009 low to the high in April 2011.
There is a triple ‘M’ pattern on the quarterly MACD histogram which would be a confirmed quarterly sell signal on a quarterly closing below this quarter’s low. That is what is required for me to say we are more than likely in a much more extended mega bear market phase.
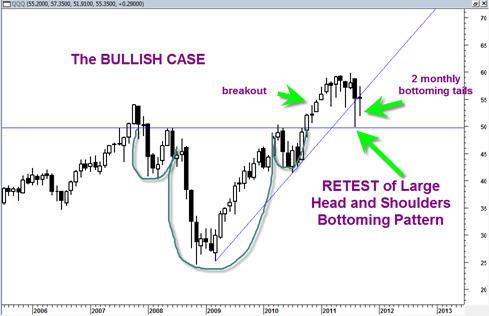
Another view of the market is from the monthly QQQ nasdaq 100 chart. It shows clearly that the Nasdaq 100 did a perfect monthly retest of the neckline of a large head and shoulder’s bottoming pattern. This retest of the neckline is very normal market behavior and usually marks an ideal continuation low risk buy point.
Since the retest the QQQ has formed an indecision doji, but both recent 2 candlesticks show large bottoming tails. The bottoming tails show demand after the retest and could be constructive for up coming price action the next several months.
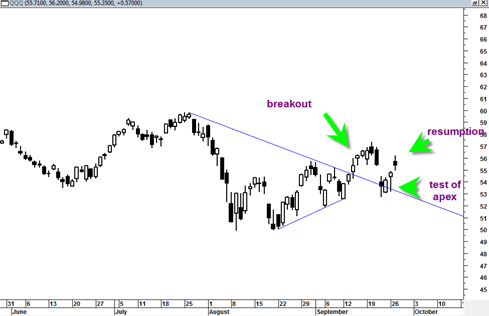
The daily chart of the QQQ shows a breakout of a triangle formation, then a retest of the apex and now a possible upwards resumption of the uptrend.
Earnings are coming out in October and I think it will provide some really good clues on whether the market can continue the uptrend into the next quarterly price candlestick. If we do see October start to trade with more uptrend then it could be a sign that the market wants to REJECT the longer term quarterly MACD sell. That would be disappointing to those looking for a ‘retest of the March 2009 lows’ or other similar ultra bear scenarios.


