
Today was the most important day in the market since the historic April 2010 top was put in. It was an extremely important day today. My weekend post entitled an extremely important chart of the sp500 was correct in that I was pointing out a very very important juncture we were in at the market over the weekend. The trading dynamics were very clear.
My presumption was that it was highly unlikely that the sp500 would just gap and go higher into October and highly unlikely it would only create a very small bottoming tail.
I was dead wrong. This is exactly what happened during the first 3 trading days of October. A very small monthly bottoming tail was created on the monthly October candlestick. That small bottoming tail for the October monthly candle was created on extremely light volume! And today we went higher on the SPY ETF with with 42% higher volume as compared to yesterday in a massive sign of strength. This strong tape action is saying that the next 3 months of trading are likely to be highly bullish. The seasonals for the stock market during the last 3 months of the year are bullish, and the market is wasting no time in showing its intention to deliver on the upside.
Today the market spoke very loudly and I have to conclude now that the bear market in force since 2007 is officially dead. Going short this market between now and the end of this year is a big mistake in my opinion. It would be an exercise in fighting the tape action and that is not known to be very profitable. I will not fight the tape. And the tape is saying we go much higher from here.
Jesse Livermore talked about ‘testing the market out’ with small initial positions to get a better feel if he was right or not and whether or not he should add to his commitment. During the last 2 weeks or so BestOnlineTrades has initiated a couple BOT Short Signals and BOTH of them have failed. This ‘testing’ of the tape has firmly convinced me that the short side is the wrong side now. In my opinion the long side is the right side and will continue to be so for quite some time.
Way back at end of August BestOnlineTrades did a volume analysis of the market and we saw market swing price tests that were being done on 50% LESS volume and then reversing back topside into the trading range. This was extremely bullish. It helped to establish my conviction that the market was making a very important bottom and that the tape would trader higher to the top of the range.
Since then the tape has traded back to the top of the range. Then it went into a 2.5 week running correction, and now WITHOUT DELAY, the tape has busted topside through an almost 3 year bear market down trendline. Need I say more ? The tape is extremely strong right now.
The volume analysis I did at end of August implies by default that since price was unable to bust through the lows of the trading range that it should try to bust through the topside of the trading range which in this case is the April 2010 highs. Today we clearly busted through the top of the initial trading range between May and end of September. Now we are cleared to attempt an attack at the April 2010 highs.
As I stated in a previous post, there is a bull market in bad news and one has to be very careful as a technical trader to avoid listening too much too all the bad economic news. Remember, there is no bull or bear side, only the right side of the market.

BestOnlineTrades expects the real ‘meat’ of the sp500 move will be over the next 3 to 6 months and that the time to act on the move is now, not later. Why? Because it is important to keep in mind that sometimes the biggest of market moves are often concentrated in the initial up bursting surge. Waiting too long for confirmation of trend can lead to poor results. They key is to identify with confidence the earliest part of a move as possible. We believe that time is now and going forward.
After the rally extends itself topside, and then exceeds the April 2010 highs, we expect the market will eventually transition into some type of long sideways trading range market that may last for quite a long time. This is just an initial theory that the market will do this. But if it does, and if it lasts for a year or longer, it will be extremely difficult to achieve profits in the indices during that period. That is why we feel the time is NOW.
The market is also now in the process of confirming (in October) a MONTHLY MACD histogram buy signal which is very significant. I made all these observations previously and had a strong bullish bias, but I have attempted the short side during the last several weeks. But again it failed and you can clearly see why from the charts in this post. Again, do not fight the tape in my opinion. Forget about all the possible reasons about why the market ‘cannot go up’. Stop listening or reading to economic news and forget about the jobs report this Friday. Focus instead on the tape and the right side of the market. The market is always right and it does not care whether you have very bearish feelings about the economy or the state of America.

Note the QUARTERLY price chart of the DJIA above. It shows that a quarterly MACD bullish cross is looming. This is extremely bullish for the much longer term basis (1 year to several years) and supports the case of much higher prices.
Also note the significance of busting higher through the April 2010 highs. It implies a move back to the all time high of 2007.
I have never been more confident about the long side of the market than I am as of today. This is the right side for the rest of the year in my opinion. I try to write with conviction and confidence when I get real clarity on the market and today is no exception. Why? Well because it is much better to be early in a new trend than at the midpoint or end point of a trend.
Lastly, I was recently reading an outstanding book by Stan Weinstein, “Secrets of profiting in bull and bear markets” and in this book he discusses the important phases of market action cycle (Stage 1 base, Stage 2 advance, Stage 3 distribution or top, Stage 4 decline) that repeats itself time and time again. I highly recommend you read this book as it has some great tips for all traders styles. The charts are not that clear, but the concepts are outstanding. His framing of the market cycles in terms of stages is superb. And if you read the book you will understand that the current point in the market is a ‘continuation buy signal of a stage 2 advance’.
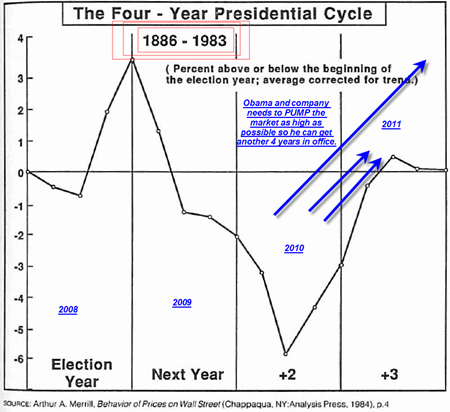
But also in the book he talks about the all important election cycle and that typically the 3rd year of the election cycle is where the market tends to perform strongly.

He indicates that the consistency of this cycle is so amazing that it is almost as if the politicians really do control the market to a certain extent. The thinking is that during the 3rd year the president needs to do everything possible to pump the market up so he/she can be re elected.
The presidential cycle fits in very nicely with BestOnlineTrades bullish forecast for the next 3 to 6 months and perhaps longer.
P.S. Don’t fight the tape !
Well the inverse H&S on the daily SPY does seem to be breaking out.
But I would hesitate just a little more since this could be a strong short covering rally often seen in bear markets.
This graph from yesterday shows an extraordinary amount of short positions
http://pragcap.com/is-the-smart-money-getting-short
Interesting chart, but for now I have to believe the breakout above channel resistance. Charts do not lie. But I do have to admit though that so far we are only 1 real day in this breakout. Need another week and the month of October to show follow through.
I have to say, Tom, you do get extremely bullish at highs and bearish at lows. Be careful of those things called emotions. 🙂 Remember the old adage about buying low and selling high.
This market is trecherous. It rarely does the obvious. Last week it sure looked like we were going to follow the 1987 chart. Now we have a breakout with all the bells and whitles to confirm it. Since almost everyone knows it is totally rigged, anything can happen. Some will figure they might as well jump on the Fed’s equity buying wagon while others will want no part of what they see as a fake rally. Only time will tell
I admit I do get too emotional at market extremes. But if you look at the long term monthly chart of sp500 some might say that I am extremely bullish at a low instead of a high…(it is a matter of perspective) problem is we will not really know the answer until a month or two down the road…
I really feel quite strongly that we are at a major low right now in terms of the bigger picture. [b]I think I am the most confident of this now than I have ever been before. [/b] If I am wrong a month or two down the road do me a favor and remind me of this comment 🙂
Tom.
Fully agree with you, I think yesterday may have been a crucial day. I think what is interesting is that some of the laggard markets, domestically and globally show signs of stirring, most notably the Bank Index in the US and the Nikkei in Japan. With regards to the Bear argument, I think a break of yesterdays low, and a close below the Monday Close Tuesday opening Gap now would probably but the bears back in charge.
Thanks Gooner. Nice to see someone on my side 🙂
If you get a chance take a look at the chart of the Jakarta Composite Index. Or maybe I can post a chart of it later. I am not saying the US markets will do the same but it has to be one of the most amazing runs I have ever seen in an index after a 50% correction.
Hey Tom,
Man I might start taking your advice as a contrarian indicator 🙂 Anyway I can’t imagine a strong year-end rally without at least a 6-7% October pullback.
Buy high!! sell Lowwww!………………………….
Of course you are welcome to take me as a contrarian indicator 🙂 I must admit I am quite surprised at how many are saying I am a contrarian indicator these days. I think I am going to use that sentiment as a contrarian indicator also 🙂
Stan Weinstein in his book said and I quote “that professionals buy high and sell higher”… This is exactly what I think is going on with the market right now.
Why do we need to have a 6 to 7% pull back in October? Just for the simple reason that it is October? Seems like questionable reasoning. If classic Wyckoff methodology is used to analyze the recent price action we have a break out above support, then a retest, then another strong up move off of support, then another minor pull back on very light volume and then yesterday another sign of strength, and then today a lack of profit taking. Trend looks higher to me, possibly in ‘trickle up’ fashion.
We may even have a decent shot at 1200 on the sp500 by the November elections..
check out the Aall Investor Sentiment Survey results for latest week – – it should be posted either late tonight or more probably early tomorrow morning
http://www.aaii.com/sentimentsurvey
my sentiments are known by my comments on this board. i am a doubter / bear. . . . . . . and no “breakout” will sway me at the moment.
Ed, That must have been you i saw across the room when they decided which way the market needs tp go.. It is a show and were all invited. LOL Good read Tom.