
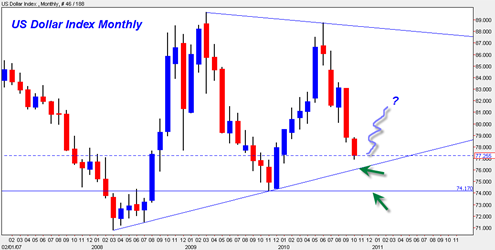
The US Dollar Index appears to be trading in a large triangle. This large triangle will either continue to form or lead to a continuation (down) breakout in the months ahead. Probability suggests that some type of bounce should occur upon hitting the upward sloping boundary line of this large triangle.
Whether or not a strong bounce from that supporting line leads to a direct market drop remains to be seen. The correlation or rising dollar/falling market has been pretty good. And it looks like the dollar only has a small distance further down before hitting uptrend support. This would seem to correlate with the stock market arriving back up at its 2010 April highs. That is a natural place for some type of downward correction to start and a natural place for the dollar to get a bounce.
Still, one cannot expect a perfect tick by tick relationship between these two indices. The US Dollar also hit the bottom of the triangle in December 2009 and rallied for 4 straight months before it started to cause some real trouble for the stock market.

The monthly chart of the US Dollar still shows that this index is still weak and I think one still has to presume more down on the longer term perspective before more up. It will be important to see how the US Dollar reacts at boundary support and how much if any bounce can be achieved.
The next major dollar moves could also cause some rumblings in the gold market as well.