
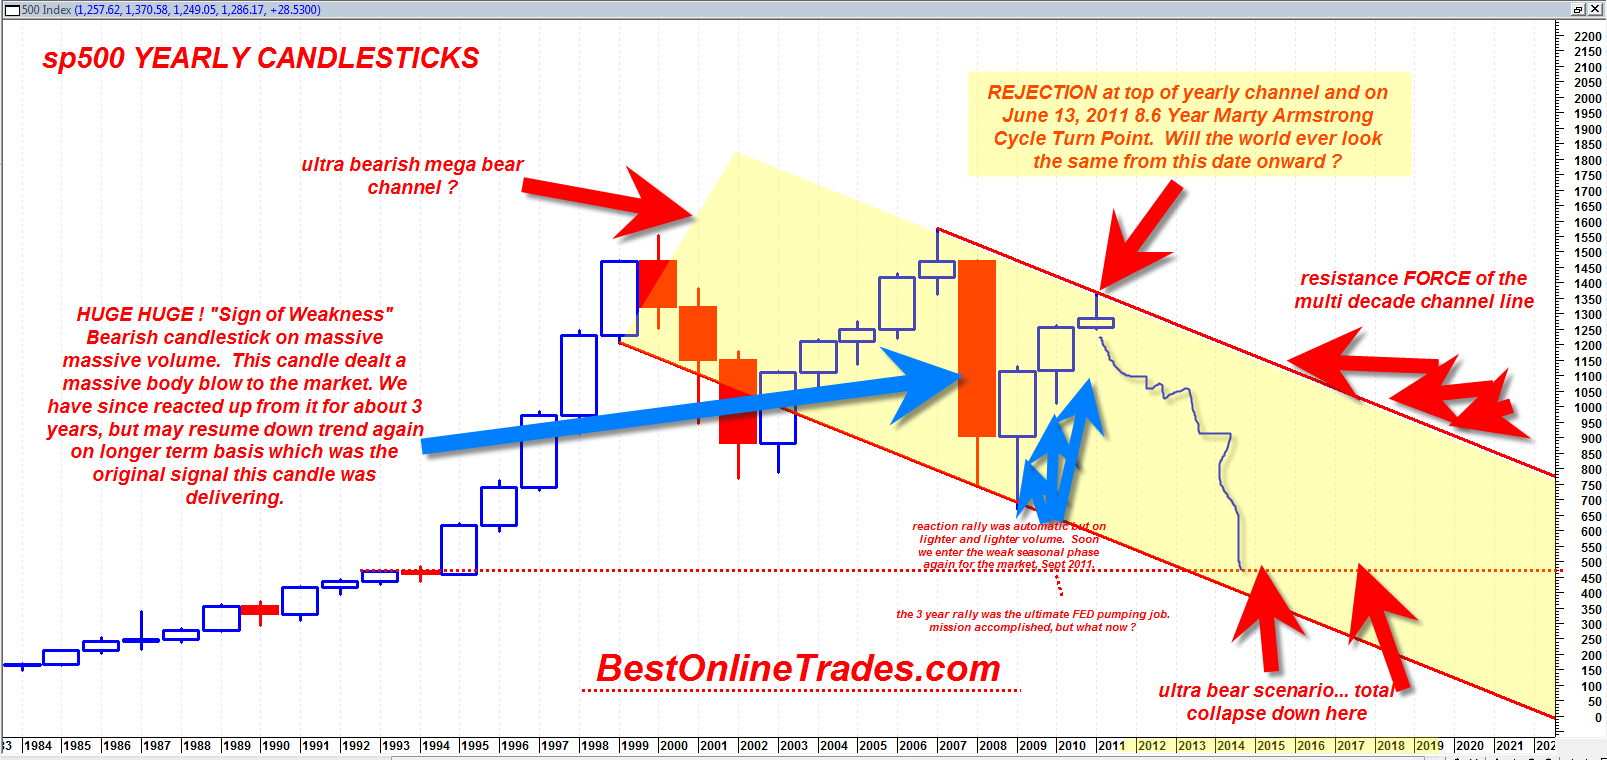
The chart you are about to see below may be one of the most important sp500 charts I have ever created with possible dramatic implications for the next 5 to 10 years. This long term chart is much different than the other longer term multi year charts because this one shows a down trending channel. My previous multi year chart shows a massive horizontal channel which is still valid. But the horizontal multi year channel implies a simple trading range instead of a mega bear channel.
The very long term chart of the sp500 on the yearly basis shows that there exists the possibility that we are not hitting the top portion of a mega yearly channel right on the Marty Armstrong Cycle turn date and that this turn could mark the beginning of a multi year down move back to the bottom of the channel.
If true then it would put the sp500 eventually near 450 by 2016? That is an extremely rough guess.
The most interesting aspect of the theory is whether we are at a valid top right now that does turn into an extended bear leg for the next several years which would be consistent with a market that wants to move back down to the bottom portion of the yearly channel.

It is very important to emphasize that it is still unknown whether the current bearish reaction from the top portion of this channel will hold as a sustained bearish reaction. Breaking below 1250 on the sp500 will be a sign that the bear channel is working.
A break upwards and through this bear channel looks unlikely now but cannot be entirely ruled out yet.
Note also the extremely bearish yearly 2008 candlestick which was a major sign of weakness that kicked off this bear channel decline. The 3 year reaction up from this down candle has been on weaker and weaker volume. In addition the volume has been very weak as we hit the top portion of the channel line. This is not a bullish sign and is quite the opposite.
The market is always delivering possibilities and potential scenarios. There are moderately bearish scenarios and ultra bearish scenarios. The ultra bearish scenarios are exceedingly rare. But we are living in extraordinary times. I can envision an ultra bearish scenario whereby we get a similar bearish looking YEARLY Candlestick that looks just like the 2008 yearly candlestick, but even more bearish. if we do get that, then it could put the sp500 at 550 by mid 2012.
That ultra bear scenario makes sense when we consider the possibility that we are doing a massive A B C down leg having just completed the B leg up. It makes sense when we consider the volume aspect as well. (down volume versus up volume). September October of this year could start to lead to some real fireworks on the bear side.
BestOnlineTrades correctly issued a BOT Short Signal on May 11, 2011 at 1338 on the sp500. Then we switched to neutral on May 31, 2011 on what looked like a northward channel breakout. But it was a very dangerous head fake.
Then, after that we switched back to BOT Short Signal on at 1310 on June 2, 2011.
BestOnlineTrades has also been correct to over emphasize the importance of the Marty Armstrong 8.6 year cycle turn date months ahead of time (even going back as far as February 2011). If you are skeptical of Marty’s turn dates then take a look at this previous post I did where it nailed the top in real estate in 2007. It is possible we are at another turn juncture in real estate right now with perhaps the same powerful signal as was seen in 2007.
In the short term daily chart of the sp500 it seems reasonable to expect a bounce higher this week. We did close below an important support range today however but on less volume than two previous important price swings in this range.
In my opinion a test of 1250 is still coming eventually as I have hinted on several times already. I expect that once there, we should see some type of bounce or stoppage point (pause point) in the current decline.
Also notable, BestOnlineTrades was correct to make an important observation on the massive monthly hanging man candlestick on the sp500.
Stay tuned to BestOnlineTrades for ongoing MULTI YEAR coverage of this possible important juncture in the market.
Your yearly chart looks like it could turn into a “Falling Three Methods” bearish candle stick pattern. If so then 2011 will not be the beginning of the big fall off but instead we would have to wait till 2012
TOM,
That is the monthly M_A pattern that I have been referring to in the past. Its the same chart except on the monthly- but the pattern is the same. And as I’ve said it could see the SPY all the way down to mid 40s level. Seems like we are brewing up the perfect storm for that to happen. We’ve completed the M portion of the pattern. Now we have to see if the A portion is starting to play out. If the topping tail holds or if we stay within that downward channel, then most likely the A pattern will play out. But I personally don’t think the Fed will let that happen. They will devalue the dollar as much as they need to in order to inflate the markets.
I WOULD SAY THE FED WILL LET IT HAPPEN JUST TO BURN INTO EVERYONES MIND THAT WE DO NEED QE3
Ed,
I feel your frustration too. The Federal Reserve is out of control. How the hell is a “non-government” entity given so much power? I read in the papers today that US has about 61 trillion trillion in liabilities right now- yes 61 trillion! The only way to pay it off is to monetize the debt and debase dollar. I feel QE2 is just a start; bring on QE3,4,5 etc… If our politicians were serious about anything, they would put forth some serous spending cuts, and the Federal Reserve would stop printing money on these useless monetary polices. But I guess I am expecting too much common sense. Either way, the average American is going to get screwed in a very bad way.
The UUP has been trying to bounce after doing a 100% retracement (almost) of the recent rally…
so the UUP really needs to get a grip here and rally.. otherwise maybe the Fed wins again as you all have mentioned…
I don’t think there will be another QE3,4,5…as such.
I have been thinking that we will see the dollar rise and commodities and equities fall over the summer.
Gold and silver will tank, and many will sell their positions and physical bullion.
Then sometime later this year the government will do a formal over night devaluation of the dollar of say 50% or a renumeration which would entail trading in say 5 old dollars for 1 new dollar
Those in debt will benefit as will the government. Those who have cash with out gold or silver as a hedge will be devastated. It will be too late to buy precious metals at that time since most of the move would have been made overnight.
And of course we will lose our world reserve currency status
Any near term dollar bounce will probably be a short term bounce. Considering Europe crisis, one could expect a dollar bounce during the summer. But over the long run, I think dollar continues its fall. You can’t just print all these dollars and expect it to have to same value. And yes I do expect the dollar to lose its reserve status in a few years. But I dont think that overnight devaluation is possible. There will be riots in the streets, collapse in our financial markets, the whole world would go into panic if a devaluation like that were to occur. Our government can’t possibly be that stupid. Or can they? Nothing will surprise me anymore.
It’s already happened before so it wouldn’t surprise me.
http://socialize.morningstar.com/NewSocialize/forums/t/231132.aspx