
The sp500 managed in the final days of the quarter to change more negative looking quarterly candlestick into a more neutral looking candlestick.
The quarterly candlestick now looks like a simply morphed doji or tendency towards a reversal hammer. Whatever you want to call it, I have seen these types of candles form right under important resistance zones as consolidation candlesticks that lead to upside breakouts.
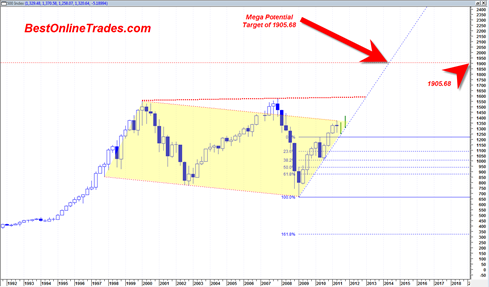
The resistance zone in the chart below is the 10 year sideways bear channel. I break above this channel would be a bullish longer term sign and should lead to the sp500 moving to about 1600 and then with an outside chance of moving to a target of 1905.68.
The 1600 potential target is the top resistance band of a very large broadening wedge resistance line.
The 1905.68 longer term target, perhaps by end 2013 is calculated as an A B C upward projection based on the .382 % retracement that occurred in May 2010 time frame which was a bullish retracement in the sense that it was the bare minimum and showed a market with extra strength.

Other reasons why we could bust above the channel resistance this time is that it is the third attempt and usually a market or stock succeeds on the third attempt.
It will be interesting to see if the market can break up and through the yellow shaded channel by the end of 2011. No matter when/if it does then it should have a good shot at 1600.
The blue dotted steep up trendline is the mega bull trend in force. Notably this up trend line is roughly at the same angle as the bull run from 1994 to the year 2000.
What is also interesting is that the end 1994 to 2000 rally was about 21 quarterly candlesticks. If I project the same total number of quarterly candlesticks from the March 2009 low then I come up with an end target time frame of the end of 2013.
This is potentially a very key piece of information because it could hint that the A leg structure was end 1994 to year 2000. Then the B to C leg was from year 2000 to 2009. And that now we are in the C to D leg structure where the D projection is 1905.68. In other words we could have a massive A B C D expansion structure where the A to B leg time structure is the same as the C to D leg time structure.
Ideal A B C D legs are ideally symmetrical in that time sense where A to B leg duration is the same as C to D leg time duration.
- But first things first… lets see if in the months ahead the sp500 can achieve a target upside breakout through the yellow shaded channel..
- Then lets see if the sp500 can reach a target of 1600…
- And then lets see if the sp500 can reach for 1905.68.
There will be a lot of work and energy required for that to happen…
But what the market does have going for it is seemingly perpetual bad news. The market continues to feed off of it like a piranha at Omaha’s Steak House.
What would next stop this market from a contrarian perspective? Perhaps the 100 Billion Facebook IPO in early 2012…
Strong week as was expected due to support and holiday weekend. One thing of note is that the dollar on the DXY has fallen over 2% since last week. The markets have rallied close to 4% this week, but it’s interesting to see that the inverse relationship holds. If the markets do breakout, we’ll make new all-time lows on the DXY. It has already fallen about 40% in the past decade so the question is how low can it go? Frankly, I’d be more scared about DOW 50,000 than dow 5,000. With Dow 5000, at least you would know that we were close to taking our medicine instead of kicking the can down the road. Dow 50,000 would probably mean the the worst kind of stagflation. Look at the Greece bailout. It’s a joke. Greece will ultimately have to default but again they are kicking the can down the road and creating a bigger problem instead of taking their medicine now. After greece, the other PIGS nations are next.
On a different note, I’m seeing a bit of a head and shoulders pattern forming on the daily SPY. Pivot from 2/18= left shoulder, pivot from 5/2= head, and this rally is creating a right shoulder. A close above 135 on Spy would negate it but still something to be aware of. With earnings season coming up, markets may rally and break out. But the opposite may happen if earnings dont meet expectations; and with QE 2 finished, no more easy money to prop up the markets. I’m still bearish for the summer so I’ll let the markets prove me wrong. Also my long term bear pattern is still in play as long as we don’t close above the 2007 highs on the monthly (not that it matters since I would never trade off it).
Market has just spiked up 100 points but TLT is holding after a Hammer reversal candle yesterday. We may see that change the direction of the market based on this chart. Otherwise the market continues to rally
http://allstarcharts.com/treasury-bonds-roll-over-to-spark-stock-rally/
RMT I like your comment ” I would be more scared of 50,000 Dow than 5,000 Dow”. It is great point. There is this obsession with the DJIA and pumping it higher.
The Dollar rally looks like it was not meant to be.. It cannot bust back inside its huge triangle.. so I guess that means it has more downside… what is this all leading to…? There has to be a point where the chit hits the fan.
And as far as TLT I wonder when/if that will ever collapse. I thought for sure we would have skyrocketing rates by now, but TLT is the slowest dog of a mover ever it seems…