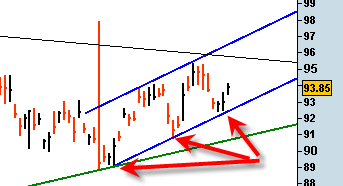
GLD ETF slightly Pierces Uptrend Channel

gld20090814

The GLD ETF slightly violated the blue uptrend channel I have been talking about this week.  The close was inside the channel however and the volume on today’s decline was really light.  I don’t like the fact that we slightly pierced the channel today but for now it is not the end of the world.

Within this up trending channel there is a slight tendency to an ascending triangle pattern with the green dotted line being the supply line and the bottom blue line being the demand line.  If I am correct in that assessment then it implies that there is not too much room left in the apex of this ascending triangle and either the pattern fails or we get a topside breakout out of the pattern which would have measurement implications within the critical upside breakout area.

Read more

UNG Natural Gas ETF Cannot get the Job Done

ung20080813

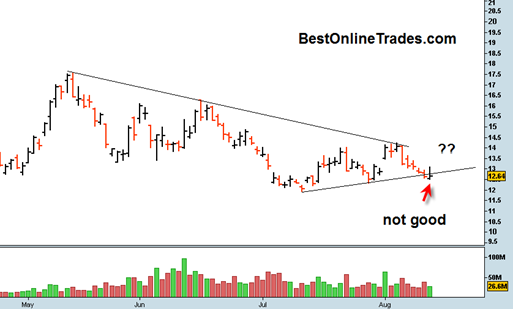
I talked about the UNG ETF several other times and at this point I am going to just have to put it in the freezer for while.  The trend has been relentlessly bearish.  I thought a couple of weeks ago that the UNG Natural Gas ETF would be able to get some sort of spike rally higher based on the monthly chart because there were some weekly divergences building and the monthly chart was showing at least some promise of a reversal in August.

But as of today the chart looks weak and horrible.  Today and yesterday we briefly broke under trendline support and may warn of an impending break below which could be really bearish.

Read more

The SPDR Gold Trust (ETF) Gets a Good Bounce Back Inside Channel

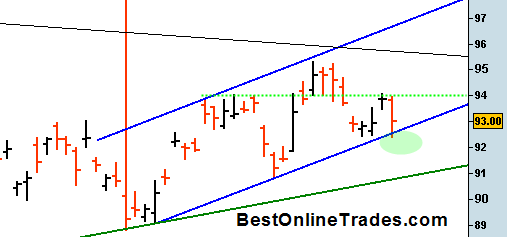
gld20090813 The SPDR Gold Trust (ETF) GLD was able to get a nice bounce going today off of blue trendline and channel support.
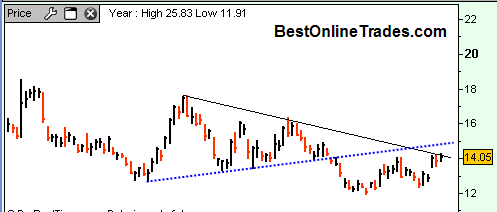
I am starting to get a few grey hairs watching this gold price trade inside the channel and also within the larger triangle.  I imagine that there are plenty of gold bugs out there who are also growing a little bit impatient with gold.  The GLD has been trading and consolidating going all the way back since March 2008.  In terms of trading time, that is a lot of time.

I am nervous about what the resolution will be with the SPDR Gold Trust (ETF) and I was especially nervous the last few days as this blue channel support was being tested and the US Dollar was perched for a breakout.

Read more

Gold Market versus US Dollar Battle Update

glduup

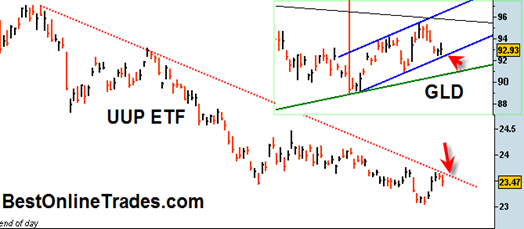
Today was a pretty wild day in the gold market.  Gold was up pretty good going into the FOMC meeting, then it sold off hard right on the FOMC decision and the US Dollar as represented by the the UUP ETF started rallying big time and was starting to create a very bullish looking hammer with price moving to the top of the bar.

By end of day, gold as represented by the GLD ETF was able to get some footing and settle for a mid range close.  The UUP also got a mid range close.  It is nice to see that the GLD ETF got a little bit of bounce going on the blue channel line I had mentioned several times before.  But it is still too close to call on whether the channel support holds for the GLD.  Perhaps the next two trading days will tell the tale.

I would absolutely love to see the GLD ETF hold this blue channel line and get a move going back UP again and towards the top portion of the channel.  That would be exciting because it could imply another possible (and maybe final ?) breakout attempt of the top portion of the symmetrical triangle.

Read more

UNG Natural Gas ETF starting to look more and more bullish

ung20090805

On a risk to reward basis which is the better trade? The gold trade or the natural gas trade?  I think they are close to equal ground, but the more I think about the more I think that the UNG ETF Natural Gas trade is the one that has more merit in terms of maximum risk reward.

But let me be clear, the UNG ETF potential move is still a much different animal than the gold market.  I don’t think it can be said that natural gas is in a long term bull market.  It is an entirely different animal.  But nevertheless it has had a massive bear market crushing decline and now looks like it wants to get started on the ‘busted pattern’ setup that I had mentioned a couple times before.

Read more

Trend should now be up for UNG Natural Gas ETF

ung20090803 After a violent retesting action in the UNG ETF I believe that UNG has now bottomed and should embark on an eventual retest of the 17.55 level.
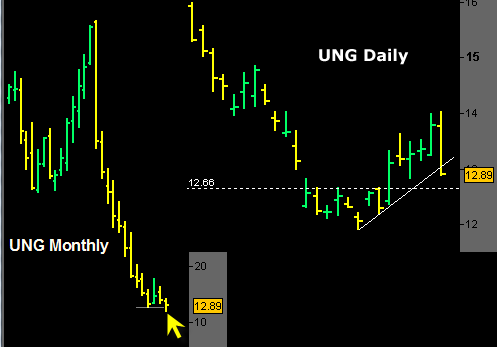
The recent break to new lows was a head fake in my opinion and we should now see a renewed bullish uptrend gain some footing.  The daily action showed that the most recent retest had to hold to keep any chance of a more significant reversal intact.

The monthly price bar chart of the UNG ETF as shown in the chart to the left tells us that the July monthly price bar showed some signs of demand in that we had a mid range close and test of the previous monthly swing 3 months previous to it.  That initial demand in the July monthly swing is spilling over to August now and I think it will continue.  Certainly there will still be volatility, but the trend will be up as I see it.

There also appears to be an island bottom formation on the UNG ETF that was confirmed as a result of today’s action and gap up.  Island bottom formations are very rare in the commodity futures market.  I don’t believe we had an island bottom on the natural gas futures contract, but I am still going to give merit to the fact that we have an island bottom on the UNG ETF.  It gives me a good dose of evidence that this is the final bottom for UNG.

Even a modest upward retracement of the UNG ETF bear market that it had could see it eventually doing a 50% move from these levels.

Read more

UNG Natural Gas ETF Reverses down hard

UNG2

Ok well I am a bit disappointed in the way UNG played out. UNG stopped out today right at the close at 12.90 for a loss of 7.06%.  I suppose it is better to be stopped out right at the close of the day than to sit on something like UNG overnight.  This was a violent in your face reversal. Wow.  The chart above shows a clear birds eye view of what is going on with UNG.

The left side of the chart is monthly price bars.  You do not have to know much about technical analysis to know that this chart depicts a crashing price and severe price weakness. But the interesting part is the most recent monthly price bar that has a little yellow arrow pointing at it.

Read more