Stock Market Steals Some Thunder from GLD ETF Today

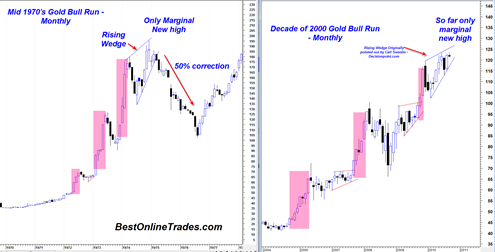
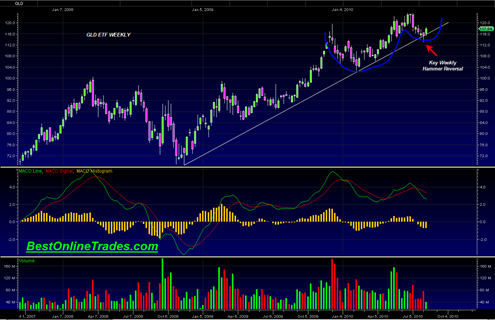
The GLD ETF was only marginally higher today while the stock market had a very strong day.  The GLD ETF finished with a daily reversal hammer and the volume today was surprisingly light. I did a post previously articulating some concern about the somewhat sluggish gold price uptrend in recent months.  The sluggish gold price … Read more

Semiconductor HOLDRs ETF Confirms MACD Histogram Buy Signal Today

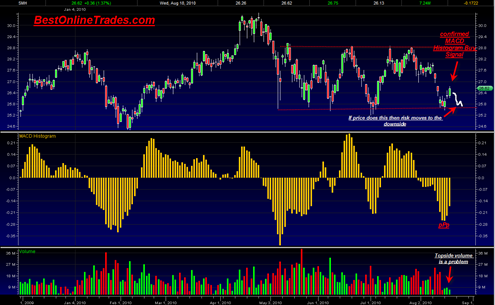
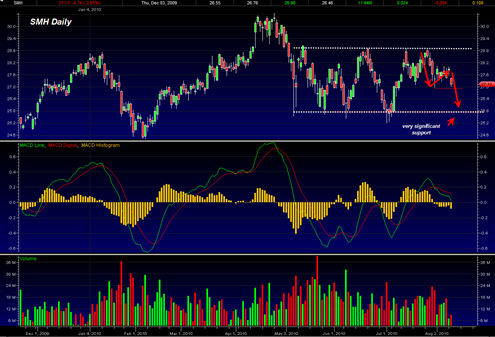
The Semiconductor HOLDRs SMH ETF today confirmed an MACD Histogram buy signal.  In previous posts I have been looking for yet another move in the broad market higher as a bounce from the bottom of the recent swing trading range. The other indices have as of yet not confirmed an MACD Histogram buy signal but … Read more

iShares Silver Trust ETF SLV Coiling Up in a Symmetrical Triangle

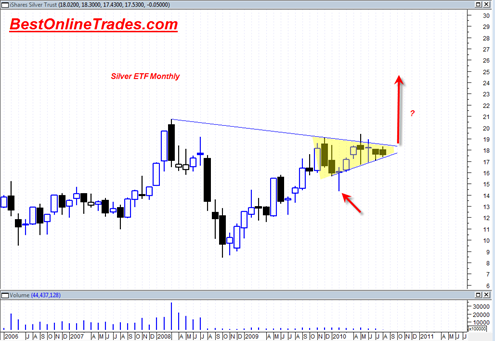
The long term iShares Silver Trust (ETF) monthly price chart of the silver ETF is showing that it is compressing into a 9 month symmetrical triangle that also appears to be the right shoulder of a much larger head and shoulders bottoming pattern. If the iShares Silver Trust (ETF) can get a move going to … Read more

SPDR Gold Trust GLD ETF Close to a MACD Histogram Confirmed Buy Signal

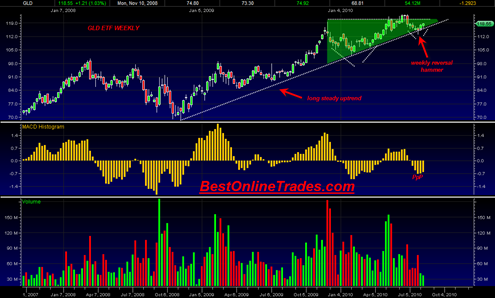
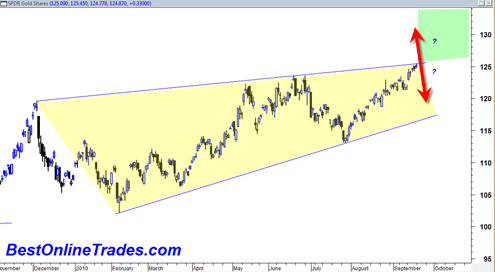
The SPDR Gold Trust (ETF) appears to be close to a weekly confirmed MACD histogram buy signal.  The GLD ETF needs to get a weekly close tomorrow above 118.42.  Currently it is trading at 118.56.

A confirmed weekly buy signal on the MACD histogram tomorrow would in our view be very significant as we are just 2 weeks away from the seasonally very powerful month of September for the gold market.

The weekly chart also shows a weekly reversal hammer of 2 weeks ago in which the trading low of that week tested the neckline of the previous head and shoulders bottoming formation.

The SPDR Gold Trust (ETF) also shows that it was able to crawl back above topside above the longer term up trendline.  This recent move appears to be creating a handle of yet another cup and handle formation which the gold market has been quite famous for time and time again.

gld20100812

One could also argue that the recent 8 to 9 month consolidation resembles that of an ascending triangle formation but is also a cup and handle pattern contained within it.

Read more

Market Vectors Gold Miners ETF Long Term Chart Looks Very Bullish

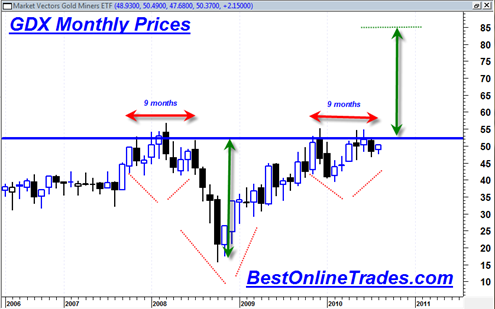
The Market Vectors Gold Miners ETF monthly long term candlestick chart looks very constructive right now.  The GDX has pretty much been left for dead for almost a year now.  The argument has been that because the mining stock index has not broken out to new all time highs, that we should assume it is … Read more